 Back
BackSection 2.2: More on Functions and Their Graphs – College Algebra Study Notes
Study Guide - Smart Notes
 Tailored notes based on your materials, expanded with key definitions, examples, and context.
Functions and Their Graphs
Describing Graphs
This section explores various ways to describe the behavior and properties of functions through their graphs. Understanding these concepts is essential for analyzing and interpreting mathematical functions in college algebra.
Increasing, Decreasing, and Constant Intervals
A function's graph can be classified based on how its y-values change as x-values increase. These classifications help describe the overall trend of the function.
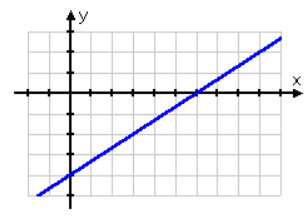
Increasing Interval: The function is increasing on an open interval if the y-values rise as the x-values get larger. The graph moves upward from left to right.
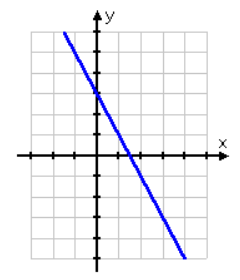
Decreasing Interval: The function is decreasing on an open interval if the y-values fall as the x-values get larger. The graph moves downward from left to right.
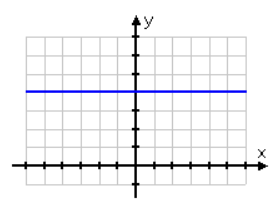
Constant Interval: The function is constant on an open interval if the y-values remain unchanged as the x-values get larger. The graph is flat from left to right.
Example: The following images illustrate increasing, decreasing, and constant functions:
When asked for intervals, focus on the x-values where the function exhibits each behavior.
Relative Maximum and Minimum
Relative extrema are important for identifying peaks and valleys in a function's graph.
Relative Maximum: A function value is a relative maximum if there exists an open interval containing such that for all in the interval.
Relative Minimum: A function value is a relative minimum if there exists an open interval containing such that for all in the interval.
Example: The graph below shows a relative minimum at the vertex of a parabola:
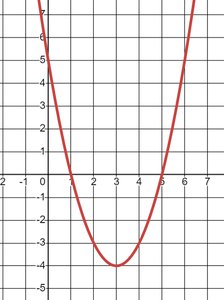
Relative maxima and minima are often referred to as the 'peaks' and 'valleys' of a graph.
Symmetry of Graphs
Symmetry helps classify functions and their graphs, making it easier to analyze their properties.
Y-axis Symmetry: A graph is symmetric with respect to the y-axis if for every point , the point is also on the graph. Substitute for in the equation; if the equation remains unchanged, the graph is y-axis symmetric.
X-axis Symmetry: A graph is symmetric with respect to the x-axis if for every point , the point is also on the graph. Substitute for in the equation; if unchanged, the graph is x-axis symmetric.
Origin Symmetry: A graph is symmetric with respect to the origin if for every point , the point is also on the graph. Substitute for and for ; if unchanged, the graph is origin symmetric.
Example:
For , test symmetry by substituting and .
For , substituting for yields , so the graph is symmetric with respect to the y-axis.
Even and Odd Functions
Even and odd functions are defined by their symmetry properties.
Even Function: A function is even if its graph is symmetric with respect to the y-axis. Algebraically, for all in the domain.
Odd Function: A function is odd if its graph is symmetric with respect to the origin. Algebraically, for all in the domain.
Neither: If a function does not satisfy either property, it is neither even nor odd.
Examples:
: Mixed powers, so neither even nor odd.
: All terms have odd powers, so the function is odd.
: Mixed powers, so neither even nor odd.
Quick Test:
If every term has an odd power, the function is odd.
If every term has an even power, the function is even.
If there are mixed powers, the function is neither.
A constant term is considered even.
Piecewise Functions
Piecewise functions are defined by different expressions for different intervals of the domain. They are useful for modeling situations where a rule changes based on input values.
Definition: A piecewise function is composed of two or more functions, each with its own domain restriction.
Example:
To graph a piecewise function, plot each segment according to its domain restriction. Find the domain, range, and evaluate at specific points as required.
Difference Quotient of a Function
The difference quotient is a fundamental concept for understanding the rate of change and slope of a function. It is used extensively in calculus and algebra.
Definition: The difference quotient for a function is given by for .
Application: It measures the average rate of change of the function over the interval .
Example: For , apply the difference quotient:
Compute
Difference quotient:
Expand and simplify to find the expression for the difference quotient.
