 Back
BackSection 5.3: Linear Inequalities and Systems of Linear Inequalities
Study Guide - Smart Notes
 Tailored notes based on your materials, expanded with key definitions, examples, and context.
Section 5.3: Linear Inequalities
Introduction to Linear Inequalities
Linear inequalities extend the concept of linear equations by introducing inequality symbols (<, >, ≤, ≥) instead of the equality sign. They are used to describe regions of the coordinate plane that satisfy certain conditions, which is especially useful in business and optimization problems.
Linear Equation: An equation of the form represents a straight line.
Linear Inequality: An inequality such as or describes a half-plane, either above or below the line.
Solution Set: The set of all points that satisfy the inequality.
Graphing Linear Inequalities
To graph a linear inequality, follow these steps:
If necessary, rewrite the inequality in slope-intercept form ().
Graph the corresponding linear equation:
Use a dashed line for strict inequalities (< or >).
Use a solid line for inequalities that include equality (≤ or ≥).
Choose a test point not on the line (often (0,0) if possible).
Substitute the test point into the inequality:
If true, shade the half-plane containing the test point.
If false, shade the opposite half-plane.
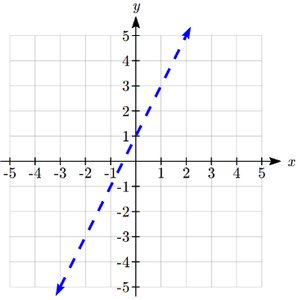
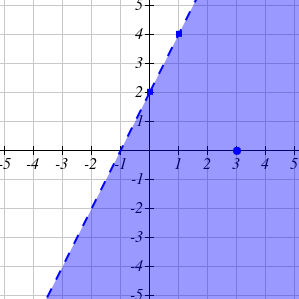
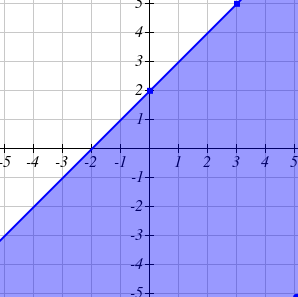
Example 1: Graphing
Graph the line as a dashed line.
Test point (3,0): (true), so shade the side containing (3,0).
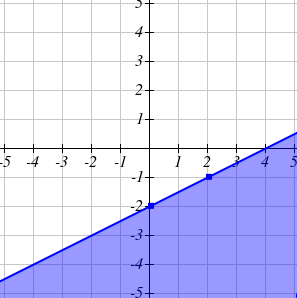
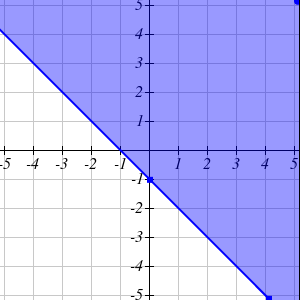
Example 2: Graphing
Rewrite as (or after manipulation).
Graph the line as a solid line (since the inequality is ≤).
Test point (0,0): (true), so shade the side containing (0,0).
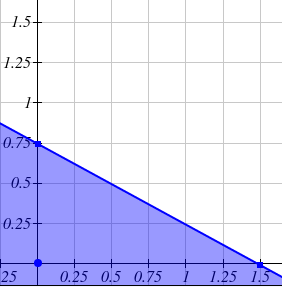
Example 3: Application – Nut Mix Cost
A store wants to create a nut mix with peanuts () and cashews () costing or less. Let = pounds of peanuts, = pounds of cashews in 1 lb of mix. The inequality is .
Find intercepts:
If :
If :
Graph the line and shade the region below it in the first quadrant.
Systems of Linear Inequalities
Introduction to Systems
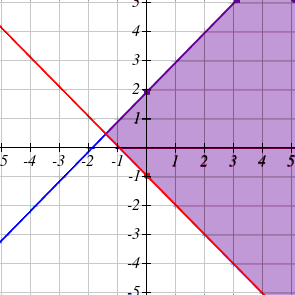
A system of linear inequalities consists of two or more inequalities. The solution set is the region where all shaded areas overlap, representing all points that satisfy every inequality in the system.
Graphical Solution: Graph each inequality and identify the intersection (overlap) of all solution regions.
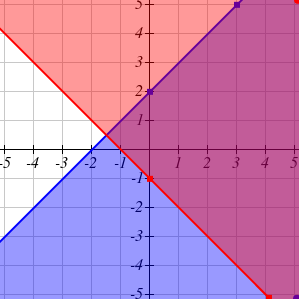
Example 4: Graphing a System
Graph the solution to the system:
Graph each inequality and shade the appropriate region.
The solution is the region where the shaded areas overlap.
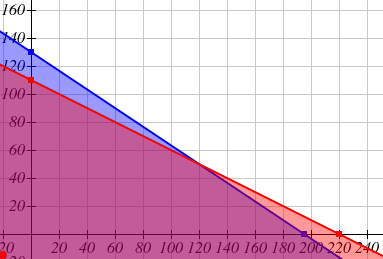
Example 5: Business Application – Production Constraints
A company produces basic and premium products. Each basic product requires 20 minutes of assembly and 15 minutes of painting; each premium product requires 30 minutes of assembly and 30 minutes of painting. The company has 3,900 minutes of assembly and 3,300 minutes of painting available per week. Let = number of basic products, = number of premium products.
Assembly constraint:
Painting constraint:
Non-negativity: ,
Graph the inequalities; the feasible region shows all possible combinations of products that can be produced within staffing limits.
Applications and Further Context
These techniques are foundational for linear programming, a branch of mathematics used for optimization in business and economics.
By analyzing the feasible region, companies can determine the best production mix to maximize profit or minimize cost.
Summary Table: Key Steps for Graphing Linear Inequalities
Step | Description |
|---|---|
1 | Rewrite the inequality in slope-intercept form if necessary. |
2 | Graph the boundary line (dashed for < or >, solid for ≤ or ≥). |
3 | Choose a test point not on the line. |
4 | Substitute the test point into the inequality. |
5 | Shade the region where the inequality is true. |
Additional info: Linear inequalities and their systems are essential for modeling real-world constraints and making optimal decisions in various fields, including business, economics, and health sciences.
