 Back
Study Guide: Analyzing Functions and Their Graphs (College Algebra)
Study Guide - Smart Notes
 Tailored notes based on your materials, expanded with key definitions, examples, and context.
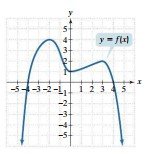
Q51. Analyze the function shown in the graph:
Background
Topic: Graphs of Functions
This question tests your ability to interpret a function's graph, including domain, range, zeros, function values, intervals of increase/decrease, and relative extrema.
Key Terms and Formulas:
Domain: The set of all possible values for which is defined.
Range: The set of all possible values that can take.
Zeros: Values of where (x-intercepts).
Intervals of Increase/Decrease: Where the graph rises or falls as increases.
Relative Maximum: Highest point in a local region.
Relative Minimum: Lowest point in a local region.
Step-by-Step Guidance
Examine the graph to determine the domain. Look for the leftmost and rightmost values where the graph exists.
Identify the range by finding the lowest and highest values the graph reaches.
Locate the zeros by finding where the graph crosses the -axis.
Find by checking the value when .
Determine intervals where the function is increasing (graph goes up as increases) and decreasing (graph goes down as $x$ increases).
Identify values of where by observing where the graph is at or below the $x$-axis.
Look for any relative maxima and the values where they occur.
Set up how to find the value of for which by locating where the graph reaches .
Check whether is positive or negative by observing the graph at .
Try solving on your own before revealing the answer!
Final Answer:
a. Domain:
b. Range:
c. Zeros:
d. :
e. Increasing: ,
f. Decreasing: ,
g. :
h. Relative maxima: At (), ()
i. :
j. : Negative
Each answer is based on careful reading of the graph. For example, the domain and range are determined by the endpoints and highest/lowest points, zeros are where the graph crosses the -axis, and relative maxima are the highest points in local regions.
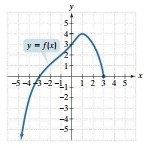
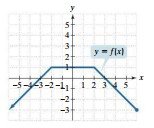
Q52. Analyze the function shown in the graph:
Background
Topic: Graphs of Functions
This question tests your ability to interpret a function's graph, including domain, range, zeros, function values, intervals of increase/decrease/constant, and relative extrema.
Key Terms and Formulas:
Domain: The set of all possible values for which is defined.
Range: The set of all possible values that can take.
Zeros: Values of where (x-intercepts).
Intervals of Increase/Decrease/Constant: Where the graph rises, falls, or stays flat as increases.
Relative Maximum: Highest point in a local region.
Relative Minimum: Lowest point in a local region.
Even/Odd/Neither: Even functions are symmetric about the -axis, odd functions are symmetric about the origin.
Step-by-Step Guidance
Examine the graph to determine the domain and range by looking at the endpoints and highest/lowest points.
Identify the zeros by finding where the graph crosses the -axis.
Find by checking the value when .
Determine intervals where the function is increasing, decreasing, or constant by observing the slope of the graph.
Identify values of where and where by checking the graph's position relative to the $x$-axis and specific values.
Check whether is positive or negative by observing the graph at .
Determine if the function is even, odd, or neither by checking for symmetry.
Set up how to check if is a relative maximum by observing the graph at .
Try solving on your own before revealing the answer!
Final Answer:
a. Domain:
b. Range:
c. Zeros:
d. :
e. Increasing:
f. Decreasing:
g. Constant:
h. :
i. :
j. : Negative
k. Even/Odd/Neither: Even
l. a relative maximum? No
The answers are based on careful reading of the graph. For example, the domain and range are determined by endpoints and highest/lowest points, zeros are where the graph crosses the -axis, and symmetry is checked for even/odd status.
