 Back
BackStudy Notes: Basics of Functions and Their Graphs
Study Guide - Smart Notes
 Tailored notes based on your materials, expanded with key definitions, examples, and context.
Section 1.2: Basics of Functions and Their Graphs
Definition of a Relation
A relation is any set of ordered pairs. The domain of a relation is the set of all first components (inputs), and the range is the set of all second components (outputs).
Domain: All possible input values (x-values).
Range: All possible output values (y-values).
Example: For the relation {(0, 9.1), (10, 6.7), (20, 10.7), (30, 13.2), (40, 21.2)}, the domain is {0, 10, 20, 30, 40} and the range is {6.7, 9.1, 10.7, 13.2, 21.2}.
Definition of a Function
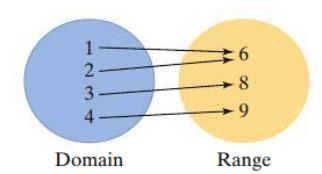
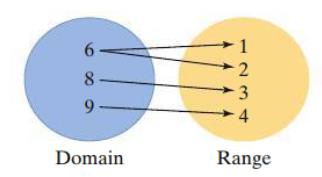
A function is a special type of relation in which each element in the domain corresponds to exactly one element in the range. This means no input (x-value) is paired with more than one output (y-value).
Function Test: If any input is associated with more than one output, the relation is not a function.
Example: The relation {(1, 2), (3, 4), (6, 5), (8, 5)} is a function because each input has only one output.
Function Notation
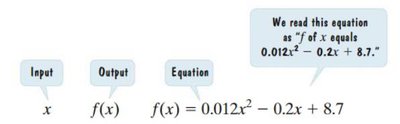
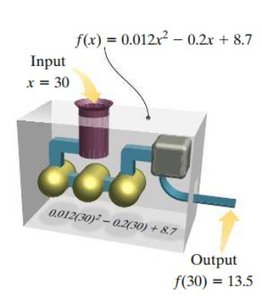
Functions are often written using function notation: f(x) represents the value of the function at x. For example, if f(x) = 0.012x^2 - 0.2x + 8.7, then f(30) is the value when x = 30.
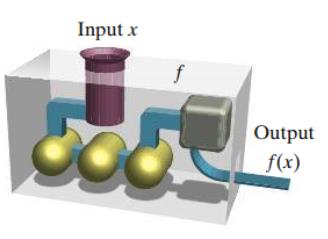
Input: The value substituted for x.
Output: The result after applying the function rule to the input.
Example: f(30) = 0.012(30)^2 - 0.2(30) + 8.7 = 13.5
Evaluating a Function
To evaluate a function, substitute the given value for x and simplify.
Example: If f(x) = 2x, then f(3) = 2 \times 3 = 6.
Graphing Functions by Plotting Points
The graph of a function is the set of all ordered pairs (x, f(x)). To graph a function, select values for x, compute the corresponding y-values, and plot the points.
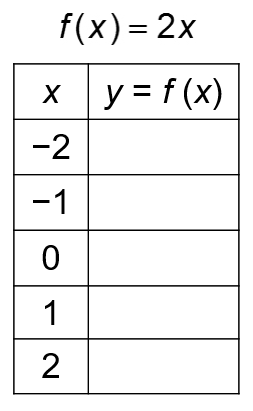
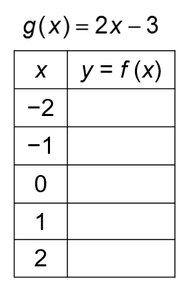
Example: Graph f(x) = 2x and g(x) = 2x - 3 for x from -2 to 2.
x | y = f(x) = 2x |
|---|---|
-2 | -4 |
-1 | -2 |
0 | 0 |
1 | 2 |
2 | 4 |
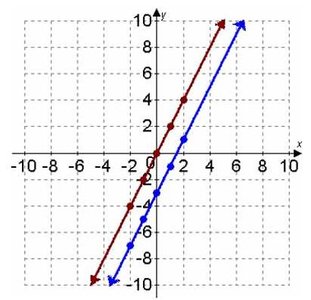
x | y = g(x) = 2x - 3 |
|---|---|
-2 | -7 |
-1 | -5 |
0 | -3 |
1 | -1 |
2 | 1 |
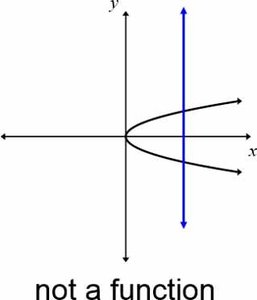
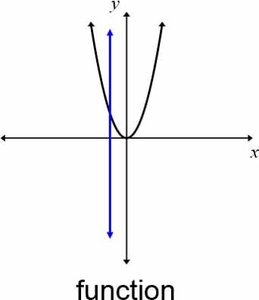
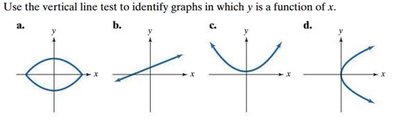
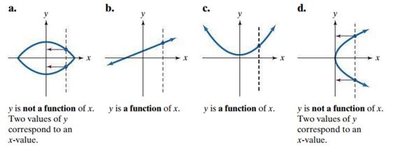
The Vertical Line Test for Functions
The vertical line test is a graphical method to determine if a graph represents a function. If any vertical line crosses the graph more than once, the graph does not represent a function.
Function: Every vertical line intersects the graph at most once.
Not a Function: Some vertical line intersects the graph more than once.
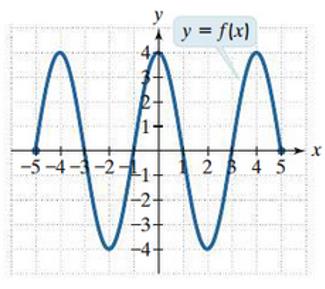
Obtaining Information from Graphs
Graphs of functions provide valuable information about the function's behavior, including domain, range, and intercepts.
Domain from Graph: The set of all x-values for which the graph has points.
Range from Graph: The set of all y-values that the graph attains.
Intercepts: x-intercepts are points where the graph crosses the x-axis (y = 0). y-intercept is where the graph crosses the y-axis (x = 0).
Note: A function can have multiple x-intercepts but at most one y-intercept.
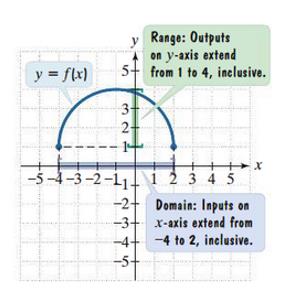
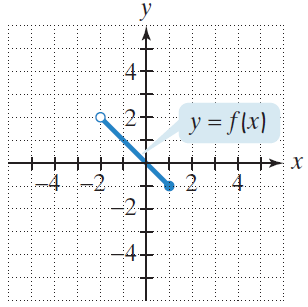
Identifying Domain and Range from a Function’s Graph
To find the domain, look for all x-values with corresponding points on the graph. To find the range, look for all y-values the graph attains.
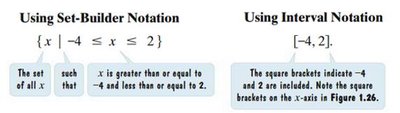
Example: For a semicircular graph extending from x = -4 to x = 2, the domain is [-4, 2] and the range is [1, 4].
Notation: Use set-builder notation or interval notation to express domain and range.
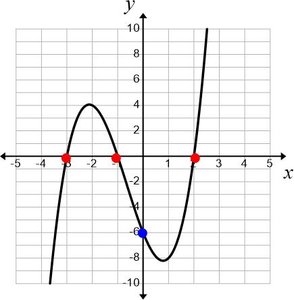
Identifying Intercepts from a Function’s Graph
Intercepts are key points where the graph crosses the axes.
x-intercepts: Points where y = 0.
y-intercept: Point where x = 0.
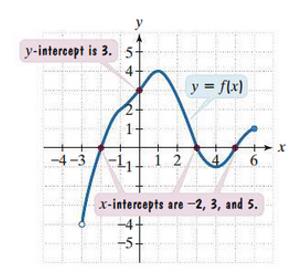
Example: A function may have x-intercepts at x = -2, 3, and 5, and a y-intercept at y = 3.
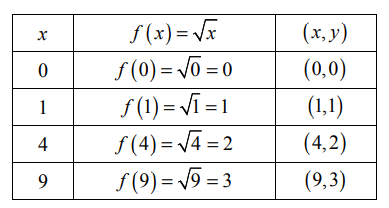
More Examples: Graphing and Comparing Square Root Functions
Square root functions can be graphed by plotting points for selected x-values. Comparing f(x) = \sqrt{x} and g(x) = \sqrt{x} - 1 shows how the graph of g is a vertical shift of f.
Table of Values: Calculate y-values for selected x-values to plot the graph.
Transformation: g(x) = \sqrt{x} - 1 is the graph of f(x) = \sqrt{x} shifted down by 1 unit.
x | f(x) = \sqrt{x} | (x, y) |
|---|---|---|
0 | 0 | (0, 0) |
1 | 1 | (1, 1) |
4 | 2 | (4, 2) |
9 | 3 | (9, 3) |
x | g(x) = \sqrt{x} - 1 | (x, y) |
|---|---|---|
0 | -1 | (0, -1) |
1 | 0 | (1, 0) |
4 | 1 | (4, 1) |
9 | 2 | (9, 2) |
Application Example: Modeling with Functions
Functions can be used to model real-world situations. For example, if you commute 40 miles to work and return at a speed 30 mph faster than your outgoing trip, the total time T (in hours) as a function of your outgoing rate x is:
Equation:
Interpretation: T(30) gives the total time if the outgoing rate is 30 mph.
Key Takeaways:
Relations and functions are foundational concepts in algebra.
Functions assign exactly one output to each input.
Graphs, tables, and equations are all ways to represent functions.
The vertical line test is a quick way to determine if a graph represents a function.
Domain and range describe the set of possible inputs and outputs, respectively.
Intercepts are important for understanding the behavior of functions.
