 Back
BackEfficiency Ratios and Earnings Quality: Advanced Financial Statement Analysis
Study Guide - Smart Notes
 Tailored notes based on your materials, expanded with key definitions, examples, and context.
Efficiency (Activity) Ratios
Introduction to Efficiency Ratios
Efficiency ratios, also known as activity ratios or asset utilization ratios, measure how effectively a company manages its assets to generate sales or cash. These ratios are crucial for assessing the operational performance of a business and its ability to convert different accounts within its balance sheet into cash or sales.
Purpose: Evaluate management's effectiveness in utilizing assets.
Key Ratios: Accounts Receivable Turnover, Inventory Turnover, Accounts Payable Turnover, Fixed Asset Turnover, Total Asset Turnover.
Types of Efficiency Ratios
Accounts Receivable Turnover: Measures how many times, on average, accounts receivable are collected in cash during the year. Indicates the efficiency of a firm’s collection and credit policies. Formula:
Inventory Turnover: Measures how many times, on average, inventory is sold during the year. Reflects the efficiency of inventory management. Formula:
Accounts Payable Turnover: Measures how many times, on average, payables are paid during the year. Provides insight into a firm’s payment patterns to suppliers. Formula:
Fixed Asset Turnover: Assesses management’s effectiveness in generating sales from investments in fixed assets (property, plant, and equipment). Important for capital-intensive firms. Formula:
Total Asset Turnover: Measures the effectiveness of generating sales from all assets. Formula:
Interpretation and Application
High turnover ratios generally indicate efficient management and asset utilization.
Low turnover ratios may signal inefficiencies or issues in asset management.
Efficiency ratios directly impact profitability by influencing the speed of cash flow and sales generation.
Earnings Quality
Introduction to Earnings Quality
Earnings quality refers to the degree of certainty and sustainability of reported income and its prospects for the future. High-quality earnings are derived from conservative accounting and strong cash flows, while low-quality earnings may result from aggressive accounting or artificial sources such as inflation.
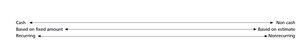
High Quality Earnings: Attributable to recurring, cash-based, and conservatively measured items.
Low Quality Earnings: Often result from nonrecurring, non-cash, or estimated items subject to manipulation.
Aspects of Earnings Quality
Cash vs Non-Cash: Cash earnings are generally of higher quality than non-cash earnings.
Recurring vs Nonrecurring: Recurring earnings are more reliable than one-time or unusual items.
Fixed Measurement vs Estimates: Earnings based on fixed amounts are more reliable than those based on estimates.
Manipulation of Earnings
Management may manipulate financial statements to achieve desired outcomes, often for personal or corporate benefit. Common manipulation techniques include:
Estimating income statement items (e.g., allowances, reserves).
Recognizing non-cash or nonrecurring items as income.
Premature revenue recognition (recording revenue before a true sale occurs).

Premature Revenue Recognition
Revenue should only be recognized when a true sale has occurred: delivery, service rendered, price determined, and collection expected.
Premature recognition can inflate earnings and mislead users.
Analysts should review financial statement notes for revenue recognition policies and monitor for unusual spikes in revenue, especially in the fourth quarter.
Allowance for Doubtful Accounts
Underestimating bad debt expense boosts net income in the short term.
Overestimating the allowance can create reserves for future income smoothing.
Price Versus Volume Change
Sales changes should be analyzed to determine if they result from price, volume, or both.
Management Discussion and Analysis (MD&A) provides context for these changes.
Real Versus Nominal Growth
Nominal growth is based on reported sales figures.
Real growth adjusts for inflation using the Consumer Price Index (CPI).
Inventory Accounting and Earnings Quality
LIFO (Last-In, First-Out): During inflation, LIFO produces lower earnings but higher-quality earnings than FIFO or average cost.
FIFO (First-In, First-Out): May result in higher earnings during inflation but lower earnings quality.
Inventory write-downs affect gross profit margins and comparability between periods.
Operating Expenses and Discretionary Expenses
Reducing discretionary expenses (e.g., repairs, R&D, advertising) can temporarily boost earnings but may harm long-term profitability.
Trends in discretionary expenses should be compared to activity levels and capital investment.
Reserves and Their Manipulation
Reserves are estimates for future obligations (e.g., doubtful accounts, warranties, restructuring).
"Cookie-jar accounting" involves over-reserving in good years and reversing reserves in bad years to smooth earnings.
"Big bath" charges are large write-offs to clean up the balance sheet, often during poor performance years.
Nonoperating Revenue and Expense
Includes gains/losses from asset sales, interest income, equity income, discontinued operations, and extraordinary items.
Nonrecurring items should be separated from core operating earnings for analysis.
Core Earnings and Pro Forma Earnings
Some companies report "core earnings," "pro forma earnings," or "EBITDA" to highlight ongoing profitability.
Analysts should adjust earnings figures to reflect items relevant to their decision-making.
Earnings Quality Spectrum
The quality of reported earnings spans a spectrum, depending on the mix of cash/non-cash, recurring/nonrecurring, and fixed/estimated components. Application of GAAP results in varying earnings quality across companies.

Case Study: Enron and Earnings Manipulation
Enron Case Overview
The Enron scandal is a classic example of financial statement manipulation. Enron used several strategies to boost profits and hide debt, misleading investors and stakeholders.
Marked-to-market accounting: Recognized profits based on estimated future value rather than actual cash flows, resulting in artificial profit inflation.
Special Purpose Entities (SPEs): Used to move debt off the balance sheet, hiding the true financial position of the company.
Misleading reporting: Managers manipulated financial statements to present a healthier financial position than reality.

Lessons from Enron
Financial reporting must reflect economic reality to ensure the quality and usefulness of information.
Users of financial statements should be vigilant for signs of manipulation and assess the quality of reported earnings.
Summary Table: Key Efficiency Ratios
Ratio | Formula | Interpretation |
|---|---|---|
Accounts Receivable Turnover | Efficiency of collecting receivables | |
Inventory Turnover | Efficiency of inventory management | |
Accounts Payable Turnover | Efficiency of paying suppliers | |
Fixed Asset Turnover | Sales generated from fixed assets | |
Total Asset Turnover | Sales generated from all assets |
Conclusion
Efficiency ratios and earnings quality are fundamental concepts in financial statement analysis. Understanding these ratios and the factors affecting earnings quality enables analysts and students to assess the true performance and sustainability of a business. Vigilance against manipulation and a critical approach to reported figures are essential for sound financial decision-making.
