 Back
BackEquity Valuation: Dividend Discount, Residual Income, Price Ratio, and DCF Methods
Study Guide - Smart Notes
 Tailored notes based on your materials, expanded with key definitions, examples, and context.
Equity Valuation
Introduction to Equity Valuation
Equity valuation is a fundamental aspect of financial accounting and corporate finance, focusing on determining the value of a company's shares. This module covers the primary models and methods used to value equity, including the Dividend Discount Model (DDM), Residual Income Model (RIM), Price Ratio Valuation, and Discounted Cash Flow (DCF) method. Understanding these models is essential for analyzing investment opportunities and making informed financial decisions.
Key Accounting and Financial Concepts
Carryover Concepts from Financial Accounting
EBIT (Earnings Before Interest and Taxes): Calculated as Sales - Cost of Goods Sold - Depreciation.
Net Working Capital (NWC): Current Assets - Current Liabilities, or (Accounts Receivable + Inventory - Accounts Payable).
Free Cash Flow (FCF):
Leverage: , where D is debt and E is equity.
Net Present Value (NPV): Represents the value of debt plus equity.
Dupont Identity:
Sustainable Growth Rate (SGR): The maximum rate at which a company can grow without external financing.
Internal Growth Rate (IGR): The maximum growth rate a firm can achieve using only internal financing.
Dividend Discount Models (DDM)
Overview of DDM
The Dividend Discount Model values a stock by estimating the present value of all expected future dividends. It is most applicable to companies that pay regular dividends.
Required Inputs: Dividend rate (D), growth rate (g), and discount rate (r).
Types of DDM:
Constant Dividend (Zero Growth)
Constant Growth (Gordon Growth Model)
Multi-Stage Growth
Constant Dividend/Zero Growth Model
Assumes dividends remain constant forever, suitable for preferred stocks.
Formula:
Example: If a preferred stock pays P_0 = \frac{2}{0.08} = $25$.
Constant Growth Model (Gordon Growth Model)
Assumes dividends grow at a constant rate g, where r > g.
Formula:
To find :
Example: If , , , then , .
Multi-Stage Growth Model
Used when dividends grow at different rates over different periods (e.g., high growth followed by stable growth).
Steps:
Forecast dividends during high-growth period.
Calculate terminal value using the Gordon Growth Model at the end of high-growth period.
Discount all cash flows to present value.
Formula for Terminal Value:
Estimating Growth and Discount Rates
Estimating the Growth Rate (g)
Historical Average Growth Rate: Use arithmetic or geometric averages of past dividends.
Industry Median/Average Growth Rate: Compare with industry peers.
Sustainable Growth Rate (SGR):


Estimating the Required Return (r)
Gordon Growth Model Rearranged:
Dividend Yield + Growth Rate: Required return equals the sum of dividend yield and expected growth rate.
Residual Income Model (RIM)
Overview of RIM
The Residual Income Model values equity as the sum of the current book value and the present value of expected future residual income. It is especially useful for firms that do not pay dividends.
Residual Income: Net income less a charge for the cost of equity capital.
Formula:
Strengths: Useful for non-dividend paying firms, less reliant on terminal value, uses accounting data.
Weaknesses: Sensitive to accounting adjustments, requires clean surplus relationship, may need adjustments for OCI and nonrecurring items.
Relative Valuation: Price Ratio Models
Price-Earnings (P/E) Ratio
Formula:
Trailing P/E: Uses earnings from the last 12 months (TTM).
Forward P/E: Uses forecasted earnings for the next 12 months.
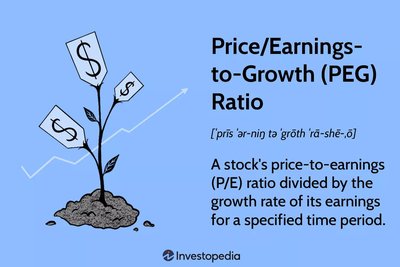
PEG Ratio (Price/Earnings-to-Growth)
Formula:
Interpretation: PEG < 1 suggests undervaluation; PEG > 2 may indicate overvaluation.
Other Price Ratios
Price/Sales (P/S) Ratio:
Price/Cash Flow (P/CF) Ratio:


Enterprise Value Ratios
Enterprise Value (EV):
EV/EBITDA Ratio: , where EBITDA is Earnings Before Interest, Taxes, Depreciation, and Amortization.
Discounted Cash Flow (DCF) Valuation
Overview of DCF
The DCF method values a company by estimating the present value of its expected future free cash flows (FCF). This approach is widely used by investment analysts and is applicable to both dividend and non-dividend paying firms.
Steps:
Forecast annual FCF for several years.
Calculate Terminal Value (TV) using the growing perpetuity formula.
Add TV to the last forecast year’s FCF.
Discount all cash flows to present value using the appropriate discount rate.
Subtract net debt to find equity value.
Divide by shares outstanding to find per share value.
Formula for Terminal Value:

Stock Markets and Trading Mechanisms
Major Stock Exchanges
New York Stock Exchange (NYSE): Largest physical exchange, hybrid market with electronic and face-to-face trading.
NASDAQ: Electronic dealer network, multiple market makers, no physical trading floor.
NYSE Organization
Designated Market Makers (DMMs): Act as dealers in specific stocks.
Floor Brokers: Execute customer orders on the exchange floor.
Supplemental Liquidity Providers (SLPs): Trade for their own accounts to provide liquidity.
NASDAQ Operations
Computer network with three levels of information access (Level 1: public quotes, Level 2: market maker quotes, Level 3: market maker order entry).
Three market tiers: Global Select, Global Market, Capital Market.
Electronic Communication Networks (ECNs) allow direct investor trading.
Summary and Takeaways
Stock valuation relies on estimating future cash flows and discount rates.
Different models are appropriate for different types of firms (e.g., DDM for dividend payers, RIM and DCF for non-dividend payers).
Relative valuation uses price ratios to compare companies.
Market prices reflect the consensus of many investors and aggregate available information.
