 Back
BackInventory and Cost of Goods Sold: Financial Accounting Study Notes
Study Guide - Smart Notes
 Tailored notes based on your materials, expanded with key definitions, examples, and context.
Inventory and Cost of Goods Sold
Introduction
This chapter explores the accounting for inventory and cost of goods sold (COGS), focusing on the methods, principles, and analysis tools used by merchandisers. Understanding these concepts is essential for accurate financial reporting and effective management decision-making in merchandising businesses.
Accounting for Inventory
Service vs. Merchandising Companies
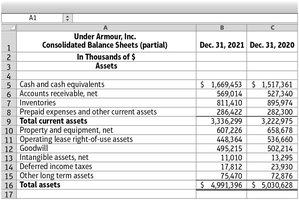
Merchandising companies differ from service companies in that they maintain inventory and report cost of goods sold on the income statement. These accounts are crucial for tracking the flow of goods and associated costs.
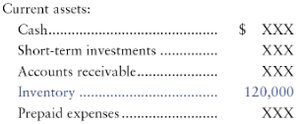
Inventory: Asset on the balance sheet representing goods available for sale.
Cost of Goods Sold (COGS): Expense on the income statement representing the cost of inventory sold during the period.
Inventory Flow and Financial Statements
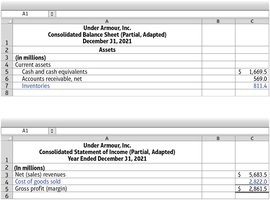
When inventory is sold, its cost shifts from the balance sheet (asset) to the income statement (expense). The difference between sales revenue and COGS is gross profit (or gross margin).
Sales Revenue: Based on the sale price of inventory sold.
Gross Profit: The excess of sales revenue over COGS. Indicates profitability before operating expenses.
Determining Inventory Quantities
Physical count at year-end confirms inventory records.
Consigned goods: Include goods out on consignment, exclude goods held for others.
Goods in transit: Ownership depends on shipping terms (FOB Shipping Point vs. FOB Destination).
Inventory Systems: Perpetual vs. Periodic
Perpetual System: Continuously updates inventory records for each purchase and sale. Physical count still required for verification.
Periodic System: Updates inventory records at period end based on physical count. Used for inexpensive goods.
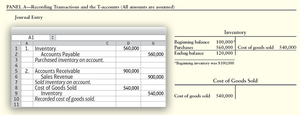
Recording Inventory Transactions (Perpetual System)
Two entries for each sale: (1) Record revenue, (2) Record COGS and reduce inventory.
Inventory cost includes purchase price, freight-in, insurance, taxes, less returns, allowances, and discounts.
Inventory Costing Methods
Overview of Costing Methods
The method chosen affects reported profits, taxes, and financial ratios. Common methods include:
Specific Identification: Assigns actual cost to each unique item (e.g., cars, antiques).
Average-Cost (Weighted-Average): Uses average cost of all units available during the period.
FIFO (First-In, First-Out): Assumes earliest goods purchased are sold first.
LIFO (Last-In, First-Out): Assumes latest goods purchased are sold first.
Effects of Costing Methods
FIFO: Lower COGS and higher ending inventory when prices rise; higher net income.
LIFO: Higher COGS and lower ending inventory when prices rise; lower net income and taxes.
Average-Cost: Results fall between FIFO and LIFO.
International Note: IFRS does not permit LIFO; only FIFO and average-cost are allowed.
U.S. GAAP for Inventory
Key Principles
Disclosure: Sufficient information for decision-making.
Representational Faithfulness: Accurate reporting of inventory methods and transactions.
Consistency: Use comparable methods across periods.
Lower-of-Cost-or-Market (LCM) Rule
Inventory must be reported at the lower of its historical cost or market value (net realizable value). If market value drops below cost, inventory is written down.
Under U.S. GAAP, write-downs cannot be reversed; under IFRS, some reversals are allowed.
ESG Factors and Inventory Valuation
Environmental, social, and governance (ESG) trends can affect inventory value. For example, declining demand for non-sustainable products may require inventory write-downs.
Inventory Analysis and Ratios
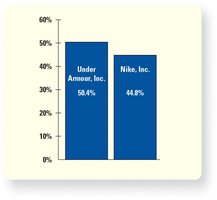
Gross Profit Percentage
Measures the proportion of sales revenue remaining after covering COGS. Indicates a company's ability to sell inventory at a profit.
Formula:
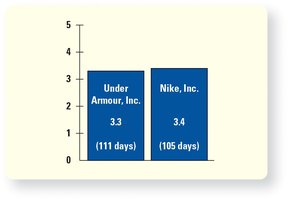
Inventory Turnover and Days Inventory Outstanding (DIO)
Inventory Turnover: How many times inventory is sold and replaced during a period.
Formula:
Days Inventory Outstanding (DIO): Average number of days inventory is held before sale.
Formula:
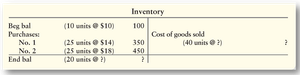
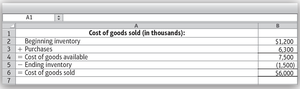
Cost-of-Goods-Sold (COGS) Model and Management Decisions
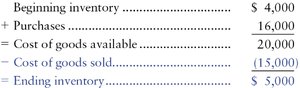
COGS Model
The COGS model helps managers plan purchases and estimate inventory needs.
Formula:
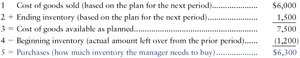
Budgeted Purchases
Managers can rearrange the COGS model to determine how much inventory to purchase:
Formula:
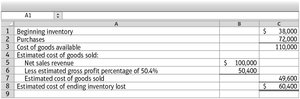
Gross Profit Method for Estimating Inventory
Used to estimate ending inventory when a physical count is not possible (e.g., after a fire). Relies on the gross profit percentage.
Estimated COGS = Net Sales Revenue × (1 – Gross Profit %)
Estimated Ending Inventory = Cost of Goods Available – Estimated COGS
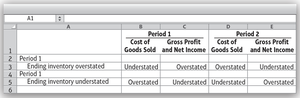
Inventory Errors and Their Effects
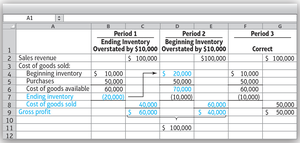
Impact of Inventory Errors
Errors in ending inventory affect two periods: the current and the following period. Errors counterbalance over two periods, but can distort reported profits and financial ratios.
Overstated ending inventory: Understates COGS, overstates gross profit and net income (current period).
Understated ending inventory: Overstates COGS, understates gross profit and net income (current period).
Analyzing Inventory Records with Excel
Using the XLOOKUP Function
Inventory records often use unique identifiers (SKU, UPC, serial numbers). The XLOOKUP function in Excel helps managers retrieve inventory details from reference files for analysis and reporting.
Application: Match transaction data with inventory descriptions, locations, and types for better decision-making.
Summary Table: Key Inventory Formulas
Formula | Description |
|---|---|
Calculates cost of goods sold | |
Measures profitability of sales | |
Indicates how quickly inventory is sold | |
Average days inventory is held | |
Determines inventory purchases needed |
