 Back
BackManagerial and Cost Accounting: Core Concepts and Applications
Study Guide - Smart Notes
 Tailored notes based on your materials, expanded with key definitions, examples, and context.
Introduction to Managerial Accounting
Managerial vs. Financial Accounting
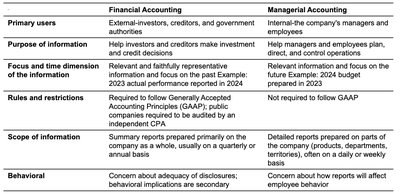
Managerial accounting focuses on providing information for internal decision-making, while financial accounting serves external stakeholders. The table below summarizes the key differences:
Financial Accounting | Managerial Accounting | |
|---|---|---|
Primary users | External: investors, creditors, government authorities | Internal: managers and employees |
Purpose of information | Investment and credit decisions | Planning, directing, controlling operations |
Focus and time dimension | Historical, past performance | Future-oriented, budgets, forecasts |
Rules and restrictions | GAAP required | Not required to follow GAAP |
Scope of information | Company-wide, periodic | Detailed, by department/product, frequent |
Behavioral | Disclosure adequacy | Impact on employee behavior |
Cost Concepts in Manufacturing
Types of Inventory
Raw Materials Inventory: Materials awaiting use in production.
Work in Process (WIP) Inventory: Goods in production but not yet complete.
Finished Goods Inventory: Completed products not yet sold.
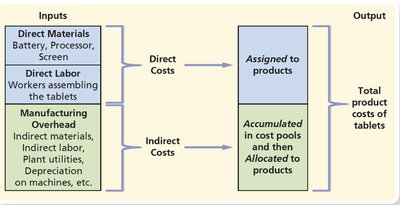
Direct and Indirect Costs
Direct Costs: Easily traced to a cost object (e.g., direct materials, direct labor).
Indirect Costs: Cannot be easily traced (e.g., manufacturing overhead).
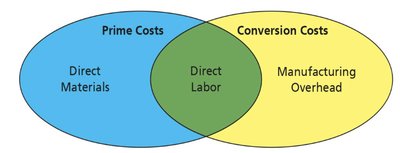
Prime and Conversion Costs
Prime Costs: Direct materials + direct labor.
Conversion Costs: Direct labor + manufacturing overhead.
Product vs. Period Costs
Product Costs: Direct materials, direct labor, and manufacturing overhead. Recorded as inventory (asset) until sold, then expensed as COGS.
Period Costs: Non-manufacturing costs (selling, administrative, taxes, interest). Expensed when incurred.
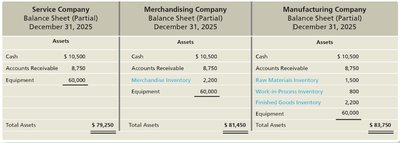
Inventory on the Balance Sheet
Different types of companies report inventory differently:
Service Company | Merchandising Company | Manufacturing Company | |
|---|---|---|---|
Inventory Accounts | None | Merchandise Inventory | Raw Materials, WIP, Finished Goods |
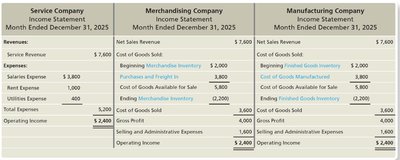
Income Statement Differences
COGS is a major expense for merchandising and manufacturing companies, but not for service companies.
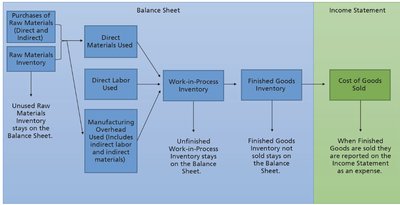
Flow of Product Costs
Cost Flow in Manufacturing
Product costs move through inventory accounts before being expensed as COGS:
Raw Materials Inventory → Work in Process Inventory → Finished Goods Inventory → Cost of Goods Sold
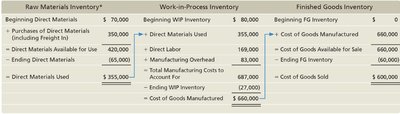
Cost of Goods Manufactured (COGM) and Sold (COGS)
COGM:
COGS (Manufacturer):
COGS (Merchandiser):
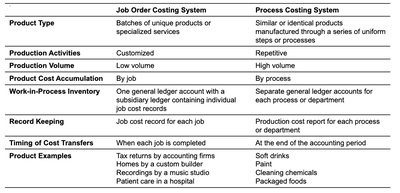
Job Order Costing vs. Process Costing
Comparison Table
Job Order Costing | Process Costing | |
|---|---|---|
Product Type | Unique jobs/services | Uniform, repetitive products |
Production Volume | Low | High |
Cost Accumulation | By job | By process |
WIP Inventory | One account | Separate for each process |
Examples | Custom furniture, tax returns | Paint, food, chemicals |
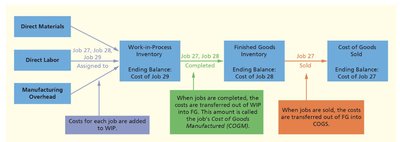
Job Order Costing Flow
Costs are assigned to specific jobs and tracked through WIP, Finished Goods, and COGS as jobs are completed and sold.
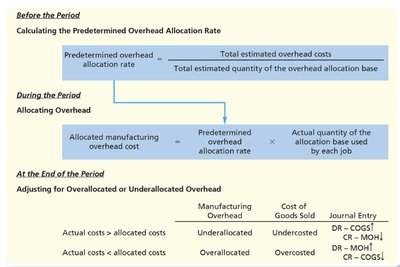
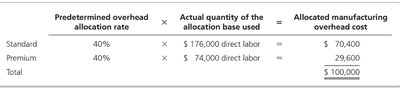
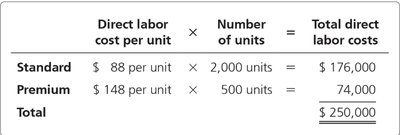
Predetermined Overhead Rate
Used to allocate manufacturing overhead to jobs before actual costs are known.
Formula:
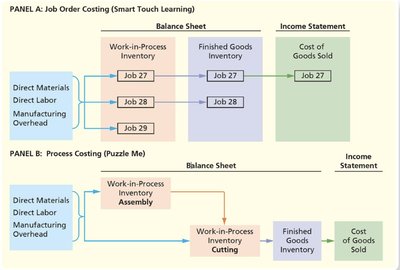
Cost Flows: Job Order vs. Process Costing
Both systems track costs through inventory accounts, but process costing uses multiple WIP accounts for each department.
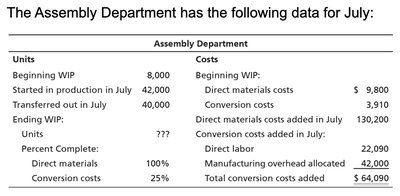
Process Costing: Equivalent Units and Cost Assignment
Assembly Department Example
Data for July is summarized below:
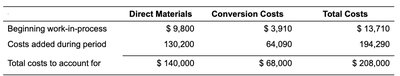
Cost to Account For
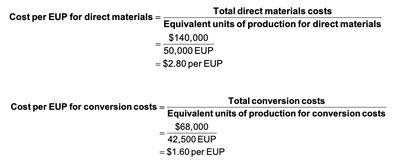
Cost per Equivalent Unit (EUP)
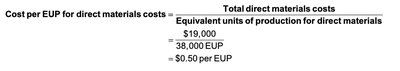
Direct Materials: per EUP
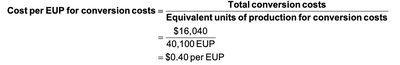
Conversion Costs: per EUP
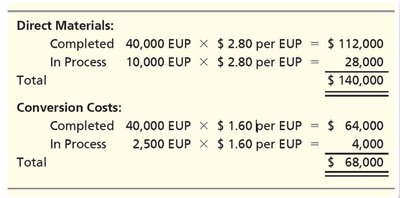
Assigning Costs to Completed and In-Process Units
Cutting Department Example
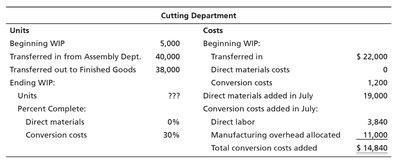
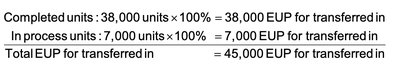
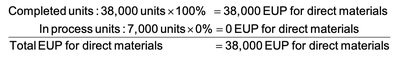
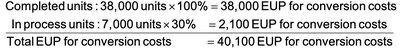
Equivalent Units Calculations
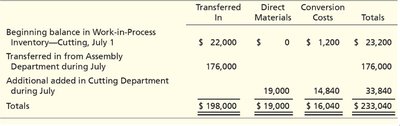
Cost to Account For in Cutting Department
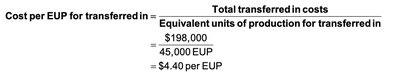
Cost per EUP Calculations
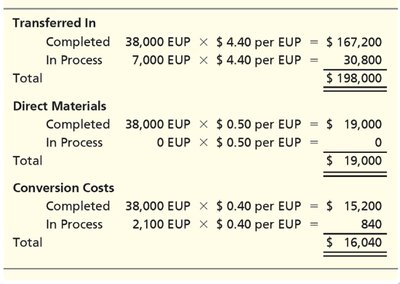
Assigning Costs in Cutting Department
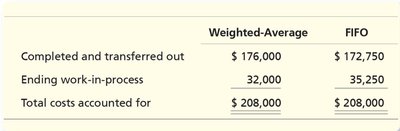
Weighted Average vs. FIFO Methods
The weighted-average method blends beginning inventory costs with current period costs, while FIFO keeps them separate.
Cost Management Systems
Direct vs. Indirect Cost Assignment
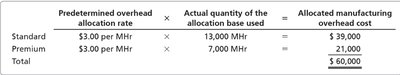
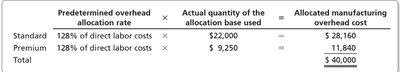
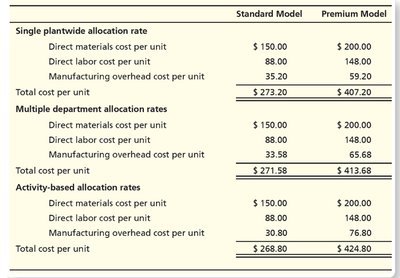
Single Plantwide vs. Multiple Department Rates
Single Plantwide Rate: One overhead rate for the entire factory.
Multiple Department Rates: Different rates for each department, improving accuracy.
Activity-Based Costing (ABC)
Allocates overhead based on activities that drive costs, not just volume.
Improves accuracy for complex products.
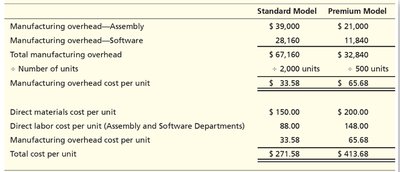
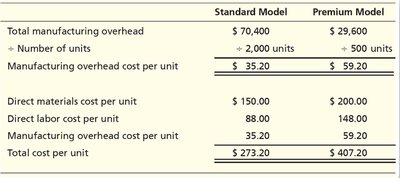
Cost per Unit Comparison
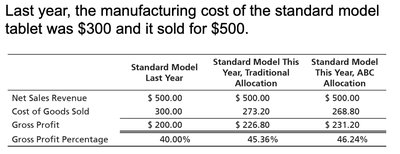
Gross Profit Analysis
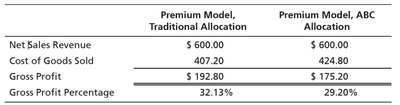
Additional info: ABC is especially useful for companies with diverse products and complex production processes, as it provides more accurate product costing for pricing and product mix decisions.
