 Back
BackMarket Ratios and Investment Analysis: Financial Statement Analysis
Study Guide - Smart Notes
 Tailored notes based on your materials, expanded with key definitions, examples, and context.
Market Ratios and Investment Analysis
Introduction to Market Ratios
Market ratios are essential tools in financial statement analysis, providing insights into the returns to stockholders and the value the marketplace assigns to a company’s stock. These ratios are crucial for investors seeking to evaluate company performance, risk, and future prospects. A thorough analysis of market ratios, combined with an understanding of the company’s environment and financial information, offers a comprehensive view of investment potential.
Key Market Ratios
Earnings Per Share (EPS)
Earnings Per Share (EPS) provides a common denominator for investors to gauge investment returns. It is a required disclosure on the income statement for publicly held companies and is a fundamental measure of profitability on a per-share basis.
Definition: EPS measures the portion of a company’s profit allocated to each outstanding share of common stock.
Formula:
Weighted Average Shares: The denominator is the weighted average number of common shares outstanding during the period, accounting for share issuances and buybacks.
Disclosure: EPS must be reported on the income statement for all publicly traded companies.
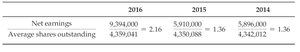
Example Calculation
Suppose a company has net income of $9,294,000 and an average of 4,299,041 shares outstanding. The EPS would be $2.16.
Diluted Earnings Per Share
Diluted EPS reflects the potential dilution that could occur if securities or contracts to issue common stock (such as options, convertible bonds, or warrants) were exercised or converted. This measure provides a "worst-case" scenario for EPS, showing the lowest possible value if all dilutive instruments are exercised.
Formula:
Example: If net income after preferred dividends is $10,000,000, with 10,000,000 shares outstanding and 1,000,000 options outstanding, diluted EPS is $0.91.

Other Types of EPS
Reported EPS (GAAP EPS): As per generally accepted accounting principles.
Ongoing/Pro Forma EPS: Adjusted for non-recurring items.
Book Value EPS: Based on the carrying value of equity.
Retained EPS: Portion of earnings retained in the business.
Cash EPS: Based on cash flows rather than net income.
Additional info: These alternative EPS measures provide different perspectives on profitability and cash generation, but only GAAP EPS is required for financial reporting.
Price-to-Earnings (P/E) Ratio
Definition and Interpretation
The Price-to-Earnings (P/E) Ratio relates earnings per share to the market price of the stock, expressing the multiple that the market places on a firm’s earnings. It is a widely used valuation metric in investment analysis.
Formula:
Interpretation: A higher P/E ratio may indicate expectations of higher future growth, while a lower P/E may suggest undervaluation or lower growth prospects.
Factors Influencing P/E: Quality of earnings, future earnings potential, industry performance, and overall market conditions.
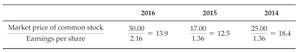
Example Calculation
If the market price per share is $30.00 and EPS is $2.16, the P/E ratio is 13.9.
Investor Considerations
What does the P/E ratio mean for an investor? It indicates how much investors are willing to pay per dollar of earnings.
Is a high or low P/E better? It depends on the context—high P/E may reflect growth expectations, while low P/E may indicate undervaluation or risk.
Dividend Payout Ratio
Definition and Calculation
The Dividend Payout Ratio measures the proportion of earnings paid out as dividends to shareholders, indicating how much profit is returned versus retained for growth.
Formula:
Interpretation: A higher ratio suggests a company is returning more profits to shareholders, while a lower ratio indicates more earnings are being retained.
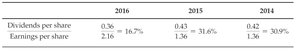
Example Calculation
If dividends per share are $0.36 and EPS is $2.16, the payout ratio is 16.7%.
Dividend Yield
Definition and Calculation
The Dividend Yield shows the relationship between cash dividends and the market price of the stock, representing the return on investment from dividends alone.
Formula:
Interpretation: A higher yield may attract income-focused investors, while a lower yield may indicate a focus on growth rather than income.
Example Calculation
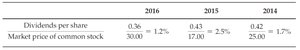
If dividends per share are $0.36 and the market price is $30.00, the dividend yield is 1.2%.
Investment Analysis: Investor Objectives and Considerations
Investor Objectives
Investors analyze market ratios to attach value to securities and make informed decisions about purchasing or liquidating investments. Key questions include:
What is the company’s performance record and future outlook?
How much risk is inherent in the firm’s capital structure?
How successfully does the firm compete in its industry?

Application: Equity Research and Case Analysis
Equity research involves comparing companies within an industry (e.g., airlines) using market ratios to select stocks for long-term investment.
Mini-cases, such as analyzing Facebook’s financial data, help develop skills in evaluating reasons for and against investment in a company’s stock.

Summary Table: Key Market Ratios
Ratio | Formula | Interpretation |
|---|---|---|
Earnings Per Share (EPS) | Profitability per share | |
Price-to-Earnings (P/E) | Market value of earnings | |
Dividend Payout Ratio | Proportion of earnings paid as dividends | |
Dividend Yield | Return from dividends |
Additional info: Market ratios are best used in conjunction with other financial analysis tools and qualitative assessments for comprehensive investment decisions.
