 Back
BackReceivables, Inventory, and Plant Assets: Principles of Accounting Chapters 5–7 Study Guide
Study Guide - Smart Notes
 Tailored notes based on your materials, expanded with key definitions, examples, and context.
Chapter 5: Receivables and Revenue
Trade Accounts Receivable
Trade accounts receivable are amounts owed to a company by its customers resulting from the sale of goods or services. These are typically classified as current assets on the balance sheet.
Definition: Receivables arising from sales of products or services.
Classification: Reported as current assets, not noncurrent assets.
Example: A company sells merchandise to a customer on credit; the amount owed is a trade receivable.
Net Realizable Value of Accounts Receivable
The net realizable value (NRV) of accounts receivable is the amount a company expects to collect, after accounting for estimated uncollectible accounts.
Formula:
Example: If Accounts Receivable is $140,000 and Allowance is $12,000, NRV is $128,000.
Allowance Method for Uncollectible Accounts
The allowance method estimates bad debts and records them as an expense, creating a contra-asset account (Allowance for Uncollectible Accounts).
Percentage of Sales Method: Bad debt expense is calculated as a percentage of credit sales.
Journal Entry:
Example: expense.
Aging Method for Allowance
The aging method estimates uncollectible accounts based on the outstanding receivables and adjusts the allowance account accordingly.
Calculation:
Adjustment: Increase allowance to required balance.
Example: ; if current allowance is expense.
Write-Offs of Uncollectible Accounts
When a specific account is determined to be uncollectible, it is written off against the allowance account.
Journal Entry:
Effect: No change in net realizable value.
Interest Calculation on Loans
Interest on loans is calculated based on principal, rate, and time.
Formula:
Example: for 6 months.
Chapter 6: Inventory and Cost of Goods Sold
Periodic Inventory Formula
The periodic inventory formula is used to calculate cost of goods sold (COGS) and beginning inventory.
Formula:
Example: If purchases are $50,000, ending inventory is $25,000, sales are $100,000, and gross profit is $32,000, COGS is $68,000 and beginning inventory is $43,000.
Perpetual Inventory System
In the perpetual system, inventory and cost of goods sold are updated continuously.
Sales Entry: Debit Accounts Receivable/Cash, Credit Sales; Debit Cost of Goods Sold, Credit Inventory.
Inventory Classification
Inventory is classified as a current asset on the balance sheet.
Current Asset: Inventory is expected to be sold or used within one year.
FOB Destination and Inventory Ownership
FOB destination means ownership transfers when goods are received by the buyer.
Implication: Goods in transit are not included in buyer's inventory until received.
Inventory Costing Methods
Different methods affect COGS and ending inventory values.
FIFO (First-In, First-Out): Oldest costs assigned to COGS; newest costs to ending inventory.
LIFO (Last-In, First-Out): Newest costs assigned to COGS; oldest costs to ending inventory.
Weighted-Average: Average cost per unit applied to both COGS and ending inventory.
Worked Example: Hefty Company Inventory Methods
Hefty Company inventory and sales:
Beginning Inventory: 500 units @ $3.00
Purchases: 1,100 units @ $3.20; 400 units @ $4.00; 1,600 units @ $4.40
Total units: 3,600; Sales: 2,700 units
Weighted-Average Calculation:
Total cost: $13,660; Average cost per unit: $13,660 / 3,600 = $3.7944
COGS: 2,700 x $3.7944 = $10,245
FIFO and LIFO: Refer to worked solutions for specific COGS and ending inventory values.
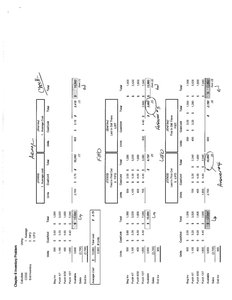
Additional info: The included image provides a comparative table of inventory costing methods (FIFO, LIFO, Weighted-Average), showing calculations for ending inventory and cost of goods sold based on the Hefty Company example. This visual aids in understanding how each method allocates costs.
Chapter 7: Plant Assets, Natural Resources, and Intangibles
Capitalization vs. Expense
Costs to acquire and prepare assets for use are capitalized; costs with no future benefit are expensed.
Capitalized: Broker's fees, freight, installation fees.
Expensed: Repairs during installation.
Asset Acquisition and Allocation
Costs related to acquiring land and constructing buildings are allocated to the respective assets.
Land: Purchase price plus legal fees.
Building: Architect's fees plus construction costs.
Example: Land: $152,000; Building: $275,000.
Subsequent Expenditures on Plant Assets
Routine maintenance is expensed; improvements that extend life or increase capacity are capitalized.
Example: Replacing tires is a maintenance expense; replacing an engine may be capitalized.
Depreciation Methods and Book Value
Depreciation allocates the cost of a tangible asset over its useful life.
Straight-Line Method:
Book Value:
Example: Truck cost $20,000, residual $4,000, 4-year life; after 3 years, book value is $8,000.
Depreciation Journal Entry
Entry: Debit Depreciation Expense, Credit Accumulated Depreciation.
Disposal of Plant Assets
When an asset is sold, remove its cost and accumulated depreciation, and record any gain or loss.
Loss: Sale proceeds less than book value.
Journal Entry: Debit Accumulated Depreciation, Credit Machinery, record Cash and Loss.
Intangible Assets and Amortization
Intangible assets are non-physical assets, amortized over their useful life.
Amortization: Systematic allocation of cost of intangible assets.
Examples: Patents, copyrights, goodwill.
Goodwill
Goodwill is the excess of purchase price over the fair value of net identifiable assets acquired in a business combination.
Recorded only when purchased: Internally generated goodwill is not recognized.
Impairment: Goodwill is not amortized, but tested for impairment.
Return on Assets (ROA)
ROA measures profitability relative to average total assets.
Formula:
Example: Net income $720,000, ROA 12%, average assets $6,000,000.
