 Back
BackChapter 1: Linear Equations and Linear Functions – Qualitative Graphs and Variables
Study Guide - Smart Notes
 Tailored notes based on your materials, expanded with key definitions, examples, and context.
Linear Equations and Linear Functions
Qualitative Graphs
Qualitative graphs are used to describe relationships between variables without specifying exact numerical values or scales. They are especially useful for visualizing trends and general behaviors in data.
Definition: A qualitative graph is a graph without scaling (tick marks and their numbers) on the axes.
Purpose: To illustrate the general direction or shape of a relationship between two variables.
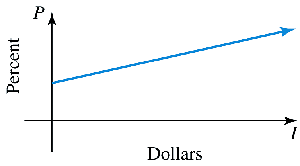
Example: The relationship between parental income (I) and the percentage of children attending college (P) is shown as an increasing trend; as income increases, so does college attendance percentage.
Explanatory and Response Variables
In mathematical modeling, variables are classified based on their roles in describing a situation. The variable that influences or explains changes is called the explanatory (independent) variable, while the variable that is affected is the response (dependent) variable.
Explanatory Variable: The variable that explains or causes changes (often plotted on the horizontal axis).
Response Variable: The variable that responds to changes (often plotted on the vertical axis).
Example 1: In a queue, the number of people ahead (N) is the explanatory variable, and the wait time (T) is the response variable.
Example 2: The weight of dumbbells (w) is the explanatory variable, and the number of lifts (n) is the response variable.
Graphing Variables
Graphs visually represent the relationship between explanatory and response variables. The horizontal axis (x-axis) is used for the explanatory variable, and the vertical axis (y-axis) for the response variable.
Axes Assignment: Explanatory variable on the horizontal axis; response variable on the vertical axis.
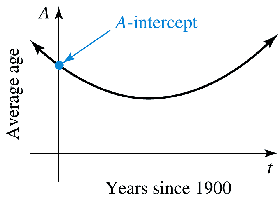
Example: The average age at first marriage (A) versus years since 1900 (t) shows a curve that decreases and then increases, forming a parabola.
Intercepts of a Curve
Intercepts are points where a curve crosses an axis. These are important for understanding initial values and boundary conditions in mathematical models.
Definition: An intercept is any point where a curve intersects an axis.
Types: x-intercept (horizontal axis), y-intercept (vertical axis), or intercepts with other axes depending on variable names.
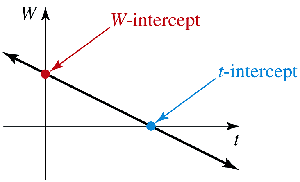
Example: A linear curve may have both a W-intercept and a t-intercept, indicating where the curve crosses the respective axes.
Sketching Qualitative Graphs
Sketching qualitative graphs involves representing the general trend of data based on the relationship between variables, without precise numerical values.
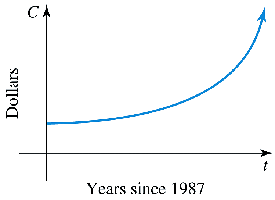
Example: The cost (C) of a Super Bowl ad over years (t) is shown as an upward-bending curve, indicating increasing costs with accelerating growth.
Guidelines: Identify which variable is explanatory and which is response, assign axes accordingly, and sketch the general trend.
Increasing and Decreasing Curves
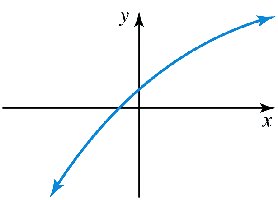
Curves can be classified as increasing or decreasing based on their direction from left to right.
Increasing Curve: Goes upward from left to right; indicates that as the explanatory variable increases, the response variable also increases.
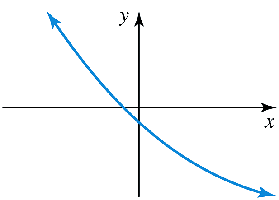
Decreasing Curve: Goes downward from left to right; indicates that as the explanatory variable increases, the response variable decreases.
Modeling Real-World Situations with Qualitative Graphs
Qualitative graphs are used to model real-world situations, such as sales versus advertising expenditure, by sketching the expected trend based on logical reasoning.
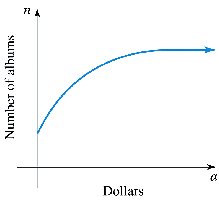
Example: The number of albums sold (n) versus advertising dollars (a) is an increasing curve that levels off, indicating saturation.
Interpretation: Even with no advertising, some sales occur; as advertising increases, sales rise but eventually plateau.
Quadrants of a Graph
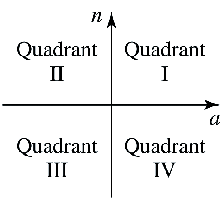
The coordinate plane is divided into four quadrants, each representing a different combination of positive and negative values for the variables.
Quadrant I: Both variables are positive.
Quadrant II: Horizontal variable is negative, vertical variable is positive.
Quadrant III: Both variables are negative.
Quadrant IV: Horizontal variable is positive, vertical variable is negative.
Guidelines for Writing Good Responses
Effective mathematical communication involves creating examples, using complete sentences, and describing concepts both specifically and generally. Comparing concepts and clarifying misunderstandings are also important.
Create Examples: Illustrate concepts with relevant situations.
Use Complete Sentences: Clearly describe key ideas and steps.
Generalize: Explain concepts without relying solely on examples.
Compare: Point out similarities and differences with other concepts.
Clarify: Address common misunderstandings and explain why procedures are valid.
Summary of Explanatory and Response Variables
Understanding the roles of explanatory and response variables is fundamental in modeling and graphing real-world situations. The explanatory variable is plotted on the horizontal axis, and the response variable on the vertical axis.
Example: Hours worked (t) versus pay received (a); t is explanatory, a is response.
Graphing Convention: Horizontal axis for explanatory variable, vertical axis for response variable.
