 Back
BackEquations of Lines: Graphing, Forms, and Relationships
Study Guide - Smart Notes
 Tailored notes based on your materials, expanded with key definitions, examples, and context.
Graphs and Functions
Equations of Lines
This section explores the fundamental concepts and methods for graphing and writing equations of lines in Intermediate Algebra. Understanding these concepts is essential for analyzing linear relationships and solving real-world problems.
Graphing a Line Using Its Slope and y-Intercept
To graph a line, it is important to know its slope and y-intercept. The slope indicates the steepness and direction of the line, while the y-intercept is the point where the line crosses the y-axis.
Slope (m): The ratio of the vertical change to the horizontal change between two points on the line.
y-Intercept (b): The value of y when x = 0.
Graphing Steps:
Plot the y-intercept on the y-axis.
Use the slope to determine the next point: move up/down and right/left according to the slope value.
Example: If the slope is and the y-intercept is 1, plot (0, 1), then move up 2 and right 3 to plot another point.
Using Slope-Intercept Form to Write Equations of Lines
The slope-intercept form of a line is a convenient way to express linear equations. It is written as:
m: Slope of the line
b: y-intercept
Example: A line with y-intercept (0, -5) and slope is written as .
Using Point-Slope Form to Write the Equation of Lines
The point-slope form is useful when you know the slope and a point on the line. The formula is:
m: Slope
(x_1, y_1): A point on the line
Example: For slope -2 and point (-11, -12): Distribute and simplify to slope-intercept form: .
Writing Equations in Standard Form
The standard form of a line is:
Example: For points (-4, 0) and (6, -1): Find the slope Use point-slope form, clear fractions, and rearrange to standard form.
Graphing Lines from Two Points
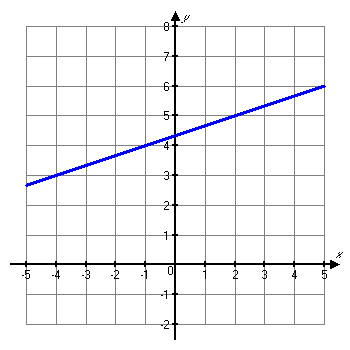
To write the equation of a line from a graph, identify two points, calculate the slope, and use either point-slope or slope-intercept form.
Example: Identify points (0, 4) and (5, 6) from the graph, calculate slope , then write the equation.
Linear Models: Real-World Applications
Linear equations can model real-world relationships, such as company growth over time.
Example: Window World, Inc. had 50 employees in 1997 and 85 in 2012. Let x = years after 1997, y = number of employees. Points: (0, 50), (15, 85) Slope: Equation: Predict for 2007 (x = 10):
Equations of Vertical and Horizontal Lines
Vertical and horizontal lines have unique equations:
Horizontal Line: (slope = 0)
Vertical Line: (undefined slope)
Example: Through (4, 5): Horizontal: Vertical:
Equations of Parallel and Perpendicular Lines
Parallel lines have equal slopes; perpendicular lines have slopes that are negative reciprocals.
Parallel Lines: If the slope of the given line is , the parallel line also has slope $m$.
Perpendicular Lines: If the slope of the given line is , the perpendicular line has slope .
Example (Parallel): Line x + 3y = 6 has slope . A parallel line through (−2, 4) is .
Example (Perpendicular): Line 3x + 2y = 7 has slope . A perpendicular line through (3, −5) has slope and equation .
Form | Equation | When to Use |
|---|---|---|
Slope-Intercept | When slope and y-intercept are known | |
Point-Slope | When slope and a point are known | |
Standard | General form, often used for systems | |
Horizontal | Horizontal lines | |
Vertical | Vertical lines |
Additional info: Academic context and examples were expanded for clarity and completeness.
