 Back
BackGraphing Linear Inequalities and Their Intersections in Two Variables
Study Guide - Smart Notes
 Tailored notes based on your materials, expanded with key definitions, examples, and context.
Graphs and Functions
Graphing Linear Inequalities
Linear inequalities in two variables are foundational in algebra and are used to describe regions of the coordinate plane that satisfy certain conditions. These inequalities are typically written in the form , where , , and are real numbers and $A$ and $B$ are not both zero. The solution to a linear inequality is a set of ordered pairs that make the inequality true.
Definition: A linear inequality in two variables is an inequality that can be written as , , , or .
Solution: An ordered pair is a solution if substituting and into the inequality yields a true statement.
Steps for Graphing a Linear Inequality
Graph the Boundary Line: Replace the inequality sign with an equal sign to obtain the boundary line. If the inequality is or , use a dashed line (points on the line are not included). If the inequality is or , use a solid line (points on the line are included).
Choose a Test Point: Select a point not on the boundary line (often if possible) and substitute its coordinates into the original inequality.
Shade the Appropriate Region: If the test point satisfies the inequality, shade the half-plane containing the test point. Otherwise, shade the opposite half-plane.
Example 1: Graph
Step 1: Graph the boundary line using a dashed line.
Step 2: Test the point : is false.
Step 3: Shade the half-plane that does not contain .
Example 2: Graph with a Solid Boundary Line
Step 1: Use a solid boundary line (for or inequalities).
Step 2: Use as a test point. If true, shade the side containing $(0,0)$.
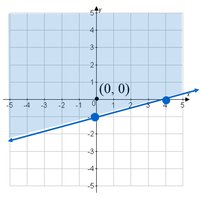
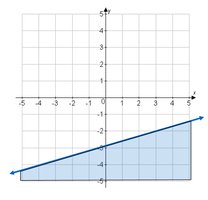
Example 3: Graph with a Solid Boundary Line and False Test Point
Step 1: Graph the solid boundary line.
Step 2: Test ; if false, shade the half-plane that does not contain $(0,0)$.
Helpful Hint
Always substitute the test point into the original inequality.
If the boundary line passes through , choose a different test point not on the line.
Graphing Intersections or Unions of Two Linear Inequalities
When working with two linear inequalities, the solution set can be found by graphing both inequalities and identifying either the intersection (overlap) or the union (combined shaded regions) of their solution sets.
Intersection: The set of points that satisfy both inequalities. This region is where the shaded areas of both inequalities overlap.
Union: The set of points that satisfy at least one of the inequalities. This region includes all points shaded by either inequality.
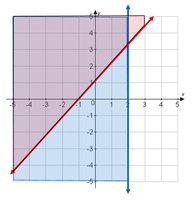
Example 7: Intersection of Two Inequalities
Graph each inequality separately.
The intersection is the region common to both shaded areas (often shown as a different color or shade).
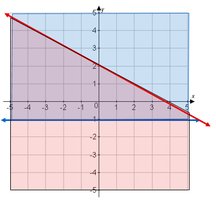
Example 8: Union of Two Inequalities
Graph each inequality separately.
The union is the combined area of both shaded regions.
Summary Table: Boundary Line Types
Inequality Symbol | Boundary Line Type | Points on Line Included? |
|---|---|---|
< or > | Dashed | No |
≤ or ≥ | Solid | Yes |
Additional info: Mastery of graphing linear inequalities is essential for solving systems of inequalities and for applications in optimization, such as linear programming.
