 Back
BackGuidance for Graphing Linear Equations by Plotting Points
Study Guide - Smart Notes
 Tailored notes based on your materials, expanded with key definitions, examples, and context.
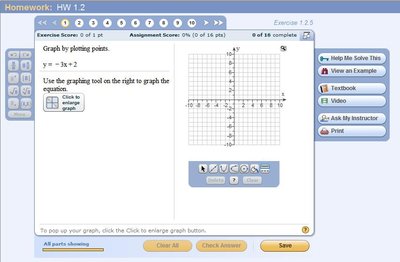
Q1. Graph by plotting points: y = 3x + 2
Background
Topic: Linear Equations and Graphing
This question is testing your ability to graph a linear equation by plotting points. You will use the equation to find several pairs of (x, y) values and then plot them on a coordinate grid.
Key Terms and Formulas
Linear Equation: An equation of the form , where is the slope and is the y-intercept.
Slope (): The rate at which changes with respect to .
Y-intercept (): The value of when .
Key formula:
Step-by-Step Guidance
Identify the slope and y-intercept from the equation . Here, and .
Choose several values for (for example, , , ) and substitute them into the equation to find the corresponding values.
For each value, calculate using and record the ordered pairs .
Plot these points on the coordinate grid. Make sure to label each point clearly.
Try solving on your own before revealing the answer!
Final Answer: Graph of y = 3x + 2
The points you plot (such as , , ) will form a straight line. The slope is 3, so the line rises 3 units for every 1 unit it moves to the right. The y-intercept is at $(0, 2)$.
Once you plot at least two points and connect them, you will have the graph of the equation.
