 Back
BackGuidance for Graphing Linear Inequalities and Systems
Study Guide - Smart Notes
 Tailored notes based on your materials, expanded with key definitions, examples, and context.
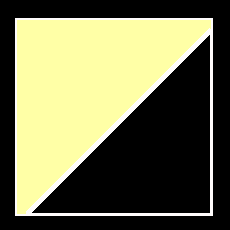
Q15. Graph the following inequality:
Background
Topic: Linear Inequalities
This question tests your ability to graph a linear inequality in two variables. You need to understand how to represent the solution set for an inequality on the coordinate plane.
Key Terms and Formulas:
Linear inequality: An inequality involving two variables, such as .
Boundary line: The line is used as the boundary for the inequality.
Shading: The region that satisfies the inequality is shaded.
Step-by-Step Guidance
Rewrite the inequality as an equation to find the boundary line: .
Determine if the boundary line should be solid or dashed. Since the inequality is "<" (not "≤"), the line should be dashed to indicate points on the line are not included.
Find two points to plot the boundary line. For example, when , ; when , .
Choose a test point (such as ) and substitute into the original inequality to determine which side of the line to shade.
Try solving on your own before revealing the answer!
Final Answer:
The solution is the region below the dashed line .
We shade the area where holds true, which is confirmed by testing a point like .
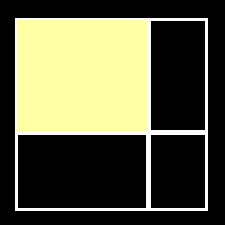
Q16. Graph the solution of the system of linear inequalities: ,
Background
Topic: Systems of Linear Inequalities
This question tests your ability to graph the solution set for a system of linear inequalities. You need to find the region where both inequalities are satisfied.
Key Terms and Formulas:
System of inequalities: Two or more inequalities graphed together.
Boundary lines: (vertical line), (horizontal line).
Shading: The region where both inequalities overlap is the solution.
Step-by-Step Guidance
Draw the boundary lines: (solid, since "≤") and (solid, since "≥").
Shade the region to the left of for .
Shade the region above for .
The solution is the intersection of the two shaded regions.
Try solving on your own before revealing the answer!
Final Answer:
The solution is the region left of and above , including the boundary lines.
This region represents all points where and .
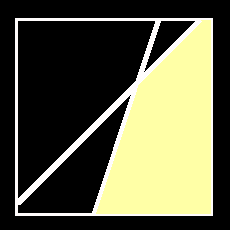
Q17. Graph the solutions of the given system of linear inequalities: ,
Background
Topic: Systems of Linear Inequalities
This question tests your ability to graph two linear inequalities and find the region where both are satisfied.
Key Terms and Formulas:
Linear inequalities: and .
Boundary lines: (dashed), (solid).
Shading: The solution is the region where both inequalities overlap.
Step-by-Step Guidance
Draw the boundary lines: (dashed, since "<") and (solid, since "≤").
Shade below for .
Shade below for .
The solution is the region where both shaded areas overlap.
Try solving on your own before revealing the answer!
Final Answer:
The solution is the region below both lines, where and .
This region represents all points that satisfy both inequalities.
