 Back
BackIntermediate Algebra: Exponential and Logarithmic Functions – Graphs and Properties
Study Guide - Smart Notes
 Tailored notes based on your materials, expanded with key definitions, examples, and context.
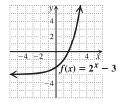
Q1. Graph
Background
Topic: Graphs of Exponential Functions
This question tests your understanding of how to graph exponential functions and recognize their key features, such as intercepts, asymptotes, and transformations.
Key Terms and Formulas:
Exponential Function: where ,
Horizontal Asymptote: For , the horizontal asymptote is .
Transformation: The shifts the graph of downward by 3 units.
Step-by-Step Guidance
Start by graphing the basic function . This function passes through and increases rapidly as increases.
Apply the vertical shift: subtracting 3 moves every point on the graph down by 3 units, so the new y-intercept is at .
Identify the horizontal asymptote. Since the graph is shifted down by 3, the asymptote is now .
Plot a few key points, such as (), (), and (), to help sketch the curve.
Try solving on your own before revealing the answer!
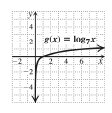
Q2. Graph
Background
Topic: Graphs of Logarithmic Functions
This question tests your ability to graph logarithmic functions and understand their properties, such as domain, range, and asymptotes.
Key Terms and Formulas:
Logarithmic Function: where ,
Vertical Asymptote: For , the vertical asymptote is .
Domain:
Range:
Step-by-Step Guidance
Start by graphing the basic function . This function passes through and increases slowly as increases.
Identify the vertical asymptote at . The graph approaches this line but never crosses it.
Plot a few key points, such as (), (), and (), to help sketch the curve.
Remember, the graph is only defined for .
Try solving on your own before revealing the answer!
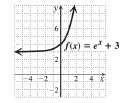
Q3. Graph and state the domain and range of the function:
Background
Topic: Graphs of Exponential Functions with Transformations
This question tests your understanding of how to graph exponential functions with vertical shifts and how to determine their domain and range.
Key Terms and Formulas:
Exponential Function:
Horizontal Asymptote: For , the horizontal asymptote is .
Domain:
Range:
Step-by-Step Guidance
Start by graphing the basic function . This function passes through and increases rapidly as increases.
Apply the vertical shift: adding 3 moves every point on the graph up by 3 units, so the new y-intercept is at .
Identify the horizontal asymptote. Since the graph is shifted up by 3, the asymptote is now .
Plot a few key points, such as (), (), and (), to help sketch the curve.
Try solving on your own before revealing the answer!
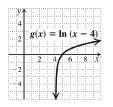
Q4. Graph and state the domain and range of the function:
Background
Topic: Graphs of Logarithmic Functions with Horizontal Shifts
This question tests your understanding of how to graph logarithmic functions with horizontal shifts and how to determine their domain and range.
Key Terms and Formulas:
Logarithmic Function:
Vertical Asymptote: For , the vertical asymptote is .
Domain:
Range:
Step-by-Step Guidance
Start by graphing the basic function . This function passes through and increases slowly as increases.
Apply the horizontal shift: replacing with moves the graph 4 units to the right, so the new vertical asymptote is at .
Plot a few key points, such as (), (), and (), to help sketch the curve.
Remember, the graph is only defined for .
Try solving on your own before revealing the answer!
