 Back
BackIntermediate Algebra: Functions, Graphs, and Rates of Change Study Guide
Study Guide - Smart Notes
 Tailored notes based on your materials, expanded with key definitions, examples, and context.
Q1. Velocity of a Train
Background
Topic: Linear Functions and Rate of Change
This question involves interpreting and working with a linear function that models the distance of a train from a station over time. You will practice evaluating the function and understanding the meaning of its slope.
Key Terms and Formulas:
Linear function:
Slope: The coefficient of in a linear equation, representing the rate of change.
Function evaluation: Substitute a value for to find .
Step-by-Step Guidance
To find , substitute into the formula .
Calculate and subtract this value from $150D(5)$.
Interpret what means in the context of the problem (distance from the station after 5 hours).
For part (b), identify the slope of the function . The slope is the coefficient of .
Think about what the slope represents in this context (how the distance changes per hour).
Try solving on your own before revealing the answer!
Final Answer:
(a) . After 5 hours, the train is 50 miles from the station.
(b) The slope is . This means the train is moving toward the station at a rate of 20 miles per hour (the distance decreases by 20 miles each hour).
Q2. Critical Thinking with Graphs (Exercise 114)
Background
Topic: Graph Analysis and Function Properties
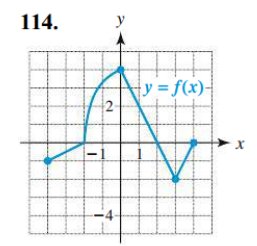
This question asks you to analyze a graph of a function and answer questions about its zeros, intercepts, intervals of positivity/negativity, increasing/decreasing behavior, and average rate of change.
Key Terms and Formulas:
Zero of a function: Value(s) of where (x-intercepts).
Y-intercept: Value of .
Positive/Negative intervals: Where the graph is above/below the x-axis.
Increasing/Decreasing: Where the graph rises or falls as increases.
Average rate of change: for from to .
Step-by-Step Guidance
Look at the graph and identify all points where the curve crosses the x-axis (these are the zeros).
Find the y-intercept by checking the value of (where the graph crosses the y-axis).
Determine the intervals where the graph is above the x-axis (positive) and below the x-axis (negative).
Identify intervals where the graph is rising (increasing) and falling (decreasing) as you move from left to right.
For the average rate of change from to , use the formula and determine if the result is positive, negative, or zero.
Try solving on your own before revealing the answer!
Final Answer:
(a) Zeros:
(b) Y-intercept: ; X-intercepts:
(c) is positive on and ; negative elsewhere.
(d) Increasing on ; decreasing on ,
(e) Average rate of change from to is negative (since ).
Q3. Matching Equations to Graphs and Analyzing Polynomial Functions
Background
Topic: Polynomial Functions and Graphs
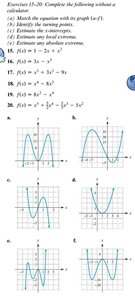
This question involves matching polynomial equations to their graphs and analyzing key features such as turning points, end behavior, and extrema.
Key Terms and Formulas:
Polynomial function: An expression of the form
Turning point: Where the graph changes direction (maximum or minimum).
End behavior: How the graph behaves as or .
Local extrema: Local maximum or minimum points.
Step-by-Step Guidance
For each polynomial equation, analyze its degree and leading coefficient to predict the general shape and end behavior of its graph.
Match each equation to the graph that fits its predicted shape and number of turning points.
Identify the turning points on each graph and estimate their locations.
Estimate the y-intercept by finding for each equation.
Locate and estimate any local extrema (maximum or minimum points) on the graphs.
Try solving on your own before revealing the answer!
Final Answer:
Each equation matches a specific graph based on degree and leading coefficient. For example, matches the graph with one inflection point and end behavior going to as and as .
Turning points and extrema can be estimated visually from the graphs.
Y-intercepts are found by evaluating for each equation.
Local extrema are the highest and lowest points between turning points on each graph.
