 Back
BackIntermediate Algebra Midterm Review Guidance
Study Guide - Smart Notes
 Tailored notes based on your materials, expanded with key definitions, examples, and context.
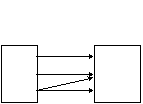
Q17. Use the vertical line test to determine whether the graph is the graph of a function.
Background
Topic: Functions and Relations
This question is testing your understanding of the vertical line test, which is used to determine if a graph represents a function. A function assigns exactly one output to each input.
Key Terms:
Function: A relation in which each input (x-value) has exactly one output (y-value).
Vertical Line Test: If any vertical line crosses the graph more than once, the graph does not represent a function.
Step-by-Step Guidance
Examine the graph provided. Look for places where a vertical line could intersect the graph at more than one point.
Imagine drawing vertical lines at different x-values. If any line touches the graph more than once, it fails the test.
Count the number of arrows from each input to outputs. If any input is mapped to more than one output, it is not a function.
Review the definition of a function and compare it to the mapping shown in the diagram.
Try solving on your own before revealing the answer!
Final Answer: Not a function
Some inputs are mapped to more than one output, so the relation fails the vertical line test and is not a function.
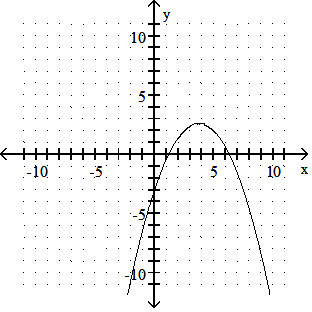
Q18. Use the vertical line test to determine whether the graph is the graph of a function.
Background
Topic: Functions and Graphs
This question asks you to use the vertical line test on a graph to determine if it represents a function.
Key Terms:
Vertical Line Test: A method to check if a graph is a function by seeing if any vertical line crosses the graph more than once.
Step-by-Step Guidance
Look at the graph and imagine drawing vertical lines at various x-values.
Check if any vertical line would intersect the graph at more than one point.
If every vertical line crosses the graph at most once, the graph represents a function.
Recall that a function cannot have two different y-values for the same x-value.
Try solving on your own before revealing the answer!
Final Answer: Function
Every vertical line crosses the graph at most once, so it passes the vertical line test and is a function.
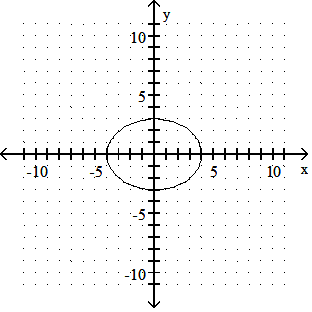
Q19. Find the domain and the range of the relation. Use the vertical line test to determine whether the graph is the graph of a function.
Background
Topic: Domain, Range, and Functions
This question tests your ability to identify the domain and range from a graph and use the vertical line test to determine if the graph represents a function.
Key Terms:
Domain: The set of all possible input values (x-values).
Range: The set of all possible output values (y-values).
Vertical Line Test: Used to determine if a graph is a function.
Step-by-Step Guidance
Examine the graph and identify the leftmost and rightmost x-values to determine the domain.
Identify the lowest and highest y-values to determine the range.
Apply the vertical line test: check if any vertical line crosses the graph more than once.
Compare your findings to the definition of a function.
Try solving on your own before revealing the answer!
Final Answer: Domain: [-4, 4], Range: [-3, 3], Not a function
Some vertical lines cross the ellipse more than once, so it is not a function.
