 Back
Linear Equations, Graphs, and Functions: Study Guide for Intermediate Algebra
Study Guide - Smart Notes
 Tailored notes based on your materials, expanded with key definitions, examples, and context.
Linear Equations in Two Variables
Interpretation and Graphing of Linear Equations
Linear equations in two variables are fundamental in algebra, representing relationships between two quantities. Their graphs are straight lines, and understanding their graphical representation is essential for solving and interpreting algebraic problems.
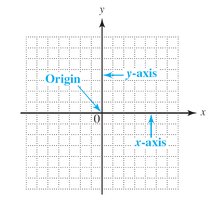
Line Graphs: Line graphs visually represent data and relationships between variables. The Cartesian coordinate system, developed by René Descartes, is used to plot points and graph equations.
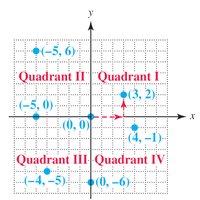
Ordered Pairs: An ordered pair (x, y) specifies a point's location in the plane, where the order of the numbers is crucial.
Plotting Ordered Pairs: To plot (x, y), move x units along the x-axis and y units along the y-axis from the origin.
Quadrants: The plane is divided into four quadrants (I, II, III, IV), read counterclockwise from the upper right.

Determining Solutions of Linear Equations
To determine if an ordered pair is a solution to a linear equation, substitute the values into the equation and check if the equality holds.
Example: For the equation , substitute (–4, 20) and (2, –5) to check if they satisfy the equation.
Key Point: Only ordered pairs that make the equation true are solutions.
Completing Ordered Pairs and Making Tables
To graph a line, it is helpful to find several ordered pairs that satisfy the equation. This can be done by assigning values to one variable and solving for the other.
Example: For , complete ordered pairs such as (0, y), (x, 0), (x, 5), and (–1, y) by solving for the missing value.
Table Construction: Tables of values help organize solutions for graphing.
Graphing Linear Equations
The graph of a linear equation is the set of all points (ordered pairs) that satisfy the equation. The standard form of a linear equation in two variables is:
Standard Form: , where A, B, and C are real numbers, and A and B are not both zero.
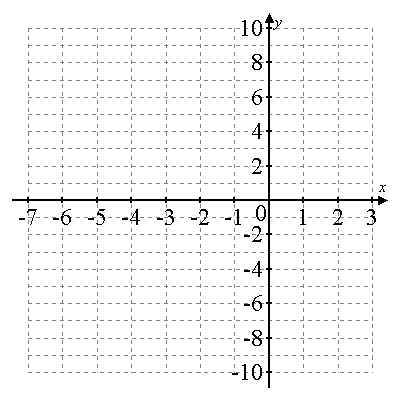
Graphing Process: Plot several points that satisfy the equation and draw a straight line through them.
Finding Intercepts
x- and y-Intercepts
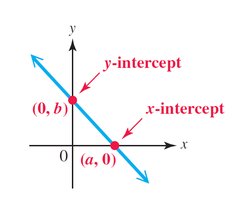
Intercepts are points where the line crosses the axes. They are useful for quickly graphing lines.
x-intercept: The point where the line crosses the x-axis (y = 0).
y-intercept: The point where the line crosses the y-axis (x = 0).
Finding Intercepts: Substitute y = 0 to find the x-intercept, and x = 0 to find the y-intercept.
Example: For , find the intercepts by setting y = 0 and x = 0, respectively.
Special Cases: Horizontal and Vertical Lines
Some linear equations represent horizontal or vertical lines.
Horizontal Line: is a line parallel to the x-axis, passing through y = b. It has no x-intercept unless b = 0.
Vertical Line: is a line parallel to the y-axis, passing through x = a. It has no y-intercept unless a = 0.
Midpoint Formula
Finding the Midpoint of a Line Segment
The midpoint of a segment is the point exactly halfway between its endpoints. The formula averages the coordinates of the endpoints.
Midpoint Formula: If P and Q are endpoints, the midpoint M is:
Example: For P(–5, 8) and Q(2, 4), the midpoint is:
