 Back
Quadratic Functions and Their Graphs: Section 8.6 Study Notes
Study Guide - Smart Notes
 Tailored notes based on your materials, expanded with key definitions, examples, and context.
Quadratic Functions and Their Graphs
Introduction to Quadratic Functions
Quadratic functions are fundamental in algebra and are characterized by their parabolic graphs. The general form of a quadratic function is f(x) = ax^2, where a is a real number. Understanding how to graph these functions and their transformations is essential for Intermediate Algebra students.
Graphing Basic Quadratic Functions
The graph of f(x) = ax^2 is a parabola. The properties of the graph depend on the value of a:
Vertex: The turning point of the parabola, located at (0, 0) for f(x) = ax^2.
Axis of Symmetry: The vertical line x = 0 divides the parabola into two symmetric halves.
Direction: The parabola opens upward if a > 0 and downward if a < 0.
Width: The parabola is narrower if |a| > 1 and wider if 0 < |a| < 1.
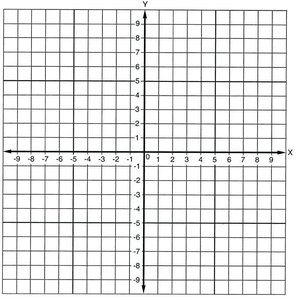
Example: Graph f(x) = x^2 and label the vertex and axis of symmetry.
Transformations of Quadratic Functions
Quadratic functions can be transformed by shifting, stretching, or compressing their graphs. The general form f(x) = a(x-h)^2 + k allows for these transformations:
Horizontal Shift: If h is positive, the graph shifts right; if h is negative, it shifts left.
Vertical Shift: If k is positive, the graph shifts up; if k is negative, it shifts down.
Vertex: The vertex is at (h, k).
Axis of Symmetry: The line x = h is the axis of symmetry.
Minimum/Maximum Value: If the parabola opens up, k is the minimum value; if it opens down, k is the maximum value.
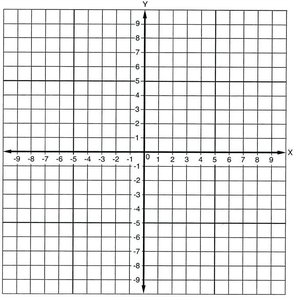
Example: Graph f(x) = 2(x-3)^2 + 1. State the vertex, axis of symmetry, and minimum/maximum value.
Comparing Quadratic Function Transformations
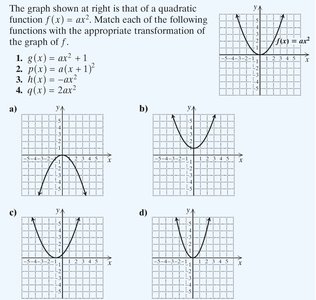
Different forms of quadratic functions result in different transformations. Consider the following:
f(x) = ax^2: Basic parabola centered at the origin.
g(x) = ax^2 + 1: Vertical shift upward by 1 unit.
p(x) = a(x+1)^2: Horizontal shift left by 1 unit.
h(x) = -ax^2: Reflection across the x-axis.
q(x) = 2ax^2: Vertical stretch, making the parabola narrower.
Example: Match each transformation to its graph.
Summary Table: Properties of Quadratic Function Graphs
Function Form | Vertex | Axis of Symmetry | Direction | Width | Shift |
|---|---|---|---|---|---|
(0, 0) | x = 0 | Up if , Down if | Narrow if , Wide if | None | |
(h, 0) | x = h | Up if , Down if | Narrow if , Wide if | Horizontal | |
(h, k) | x = h | Up if , Down if | Narrow if , Wide if | Horizontal & Vertical |
Practice Problems
Graph f(x) = 4x^2. State the vertex and axis of symmetry.
Graph f(x) = -4x^2. State the vertex and axis of symmetry.
Explain how to obtain the graph of g(x) = (x-1)^2 from f(x) = x^2.
Explain how to obtain the graph of p(x) = x^2 + 10 from f(x) = x^2.
Explain how to obtain the graph of h(x) = 8(x+2)^2 - 3 from f(x) = x^2.
For f(x) = (x+3)^2 - 1, find the vertex, axis of symmetry, and minimum/maximum value, then graph the function.
Key Points and Common Mistakes
Always identify the vertex and axis of symmetry before graphing.
Check the sign of a to determine the direction the parabola opens.
Remember that horizontal shifts are determined by h and vertical shifts by k.
Plot several points to ensure accuracy when sketching the graph.
