Indietro
Functions and Graphs: Foundations for Algebra and Trigonometry
Guida di studio - Note intelligenti
 Appunti personalizzati basati sui tuoi materiali, ampliati con definizioni chiave, esempi e contesto.
Functions and Graphs
Basics of Functions and Their Graphs
Understanding functions and their graphical representations is fundamental in algebra and trigonometry. This section introduces the concepts of relations, functions, domains, ranges, and the graphical tools used to analyze them.
Relation: A relation is any set of ordered pairs. The domain is the set of all first components (inputs), and the range is the set of all second components (outputs).
Example: For the relation {(0, 9.1), (10, 6.7), (20, 10.7), (30, 13.2), (40, 21.2)}, the domain is {0, 10, 20, 30, 40} and the range is {9.1, 6.7, 10.7, 13.2, 21.2}.
Function: A function is a special type of relation where each element in the domain corresponds to exactly one element in the range.
Example: The relation {(1, 2), (3, 4), (6, 5), (8, 5)} is a function because no x-value is repeated with a different y-value.
Functions as Equations: An equation defines y as a function of x if for every x there is only one y. If an equation gives more than one y for a single x, it is not a function.
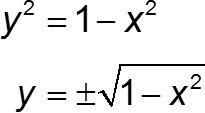
Example: The equation does not define y as a function of x because for some x, there are two possible y-values (positive and negative square roots).
Function Notation: f(x) denotes the value of the function f at x.
Evaluating Functions: Substitute the input value into the function rule to find the output.
Graphs of Functions: The graph of a function consists of all ordered pairs (x, f(x)).
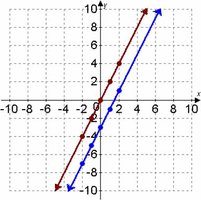
Example: Graphing f(x) = 2x and g(x) = 2x - 3 by plotting points for x from -2 to 2.
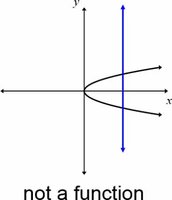
Vertical Line Test: A graph represents a function if and only if no vertical line intersects the graph at more than one point.
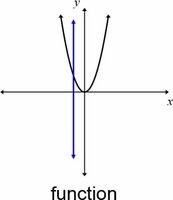
Obtaining Information from Graphs: You can find values of the function, domain, range, and intercepts from the graph.
Example: Using a graph to find f(5) or to solve f(x) = 100.
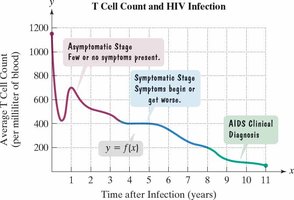
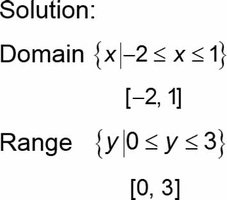
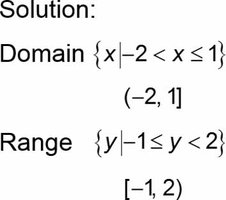
Domain and Range from Graphs: The domain is the set of all x-values with points on the graph; the range is the set of all y-values with points on the graph.
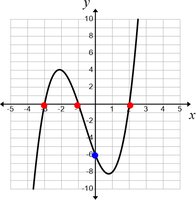
Intercepts: The x-intercepts are points where the graph crosses the x-axis (y = 0). The y-intercept is where the graph crosses the y-axis (x = 0). A function can have multiple x-intercepts but at most one y-intercept.
More on Functions and Their Graphs
This section explores how functions behave on intervals, their symmetry, and introduces piecewise functions and the difference quotient.
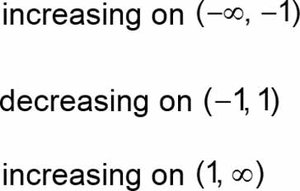
Increasing, Decreasing, and Constant Functions:
A function is increasing on an interval if f(x1) < f(x2) whenever x1 < x2.
A function is decreasing if f(x1) > f(x2) whenever x1 < x2.
A function is constant if f(x1) = f(x2) for all x1, x2 in the interval.
Example: Identifying intervals of increase, decrease, and constancy from a graph.
Relative Maximum and Minimum:
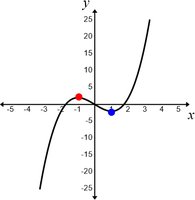
A relative maximum at x = a means f(a) is greater than nearby values.
A relative minimum at x = b means f(b) is less than nearby values.
Example: Locating relative maxima and minima on a graph.
Even and Odd Functions:
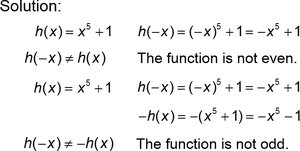
Even function: f(−x) = f(x) for all x in the domain; graph is symmetric about the y-axis.
Odd function: f(−x) = −f(x) for all x in the domain; graph is symmetric about the origin.
Example: Determining if a function is even, odd, or neither.
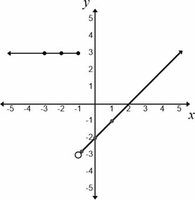
Piecewise Functions: Defined by different expressions over different intervals of the domain.
Example: Evaluating and graphing a piecewise function by considering each piece separately.
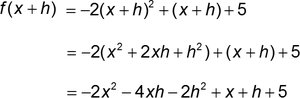
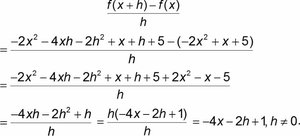
Difference Quotient: For a function f, the difference quotient is for . It is foundational for understanding rates of change and calculus.
Example: Evaluating and simplifying a difference quotient for a given function.
Linear Functions and Slope
Linear Equations and Their Graphs
Linear functions are among the most important in algebra, modeling constant rates of change. Their graphs are straight lines, and their equations can be written in several forms.
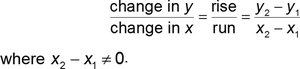
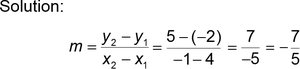
Slope: The slope m of the line through points and is given by:
Example: Finding the slope between (4, −2) and (−1, 5):
Point-Slope Form: for a line with slope m through .
Slope-Intercept Form: , where m is the slope and b is the y-intercept.
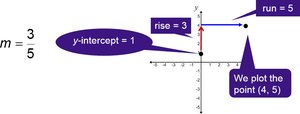
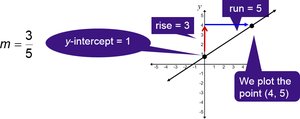
Graphing y = mx + b: Plot the y-intercept (0, b), then use the slope to find another point, and draw the line through both points.
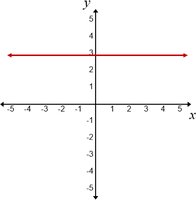
Horizontal Line: Equation is ; slope is 0.
Vertical Line: Equation is ; slope is undefined.
General Form: , where A and B are not both zero.
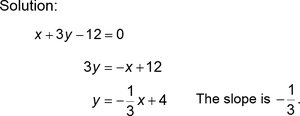
Finding Slope and Intercept: Rearranging to slope-intercept form reveals the slope and y-intercept.
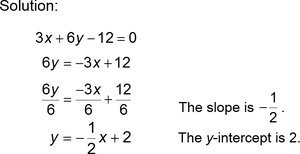
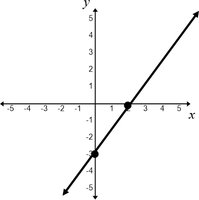
Graphing Using Intercepts: Find x-intercept (set y = 0) and y-intercept (set x = 0), plot both, and draw the line.
Applications: Linear functions can model real-world data, such as temperature as a function of CO2 concentration.

More on Slope
Parallel and Perpendicular Lines, Rate of Change
Understanding the relationship between slopes of lines is essential for analyzing geometric and real-world problems.
Parallel Lines: Two nonvertical lines are parallel if and only if they have the same slope.
Perpendicular Lines: Two nonvertical lines are perpendicular if and only if the product of their slopes is −1.
Example: The slope of a line perpendicular to is 3, since the original slope is and .
Slope as Rate of Change: Slope represents the rate at which the dependent variable changes per unit increase in the independent variable.
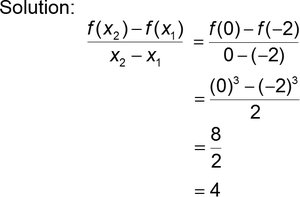
Average Rate of Change: For a function f, the average rate of change from to is .