Indietro
Physiological Response to Exercise: Cardiovascular, Respiratory, and Muscular Adaptations
Guida di studio - Note intelligenti
 Appunti personalizzati basati sui tuoi materiali, ampliati con definizioni chiave, esempi e contesto.
Physiological Response to Exercise
Overview of Exercise as a Physiological Perturbation
Exercise acts as a significant challenge to the body's homeostasis, particularly affecting the cardiovascular and respiratory systems. The body's response varies depending on the type, intensity, and duration of exercise, and involves acute and chronic adaptations.
Acute responses occur immediately during and after exercise, such as increased heart rate and ventilation.
Chronic adaptations develop over time with repeated exercise, including changes in muscle fiber composition and cardiovascular efficiency.
Different types of exercise (aerobic, anaerobic, flexibility, resistance) require distinct muscle fiber types and energy substrates.

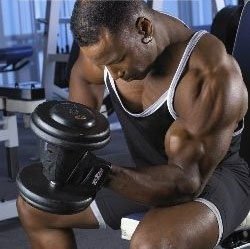
Types of Exercise
Exercise can be classified based on the primary physiological demands and muscle fiber recruitment:
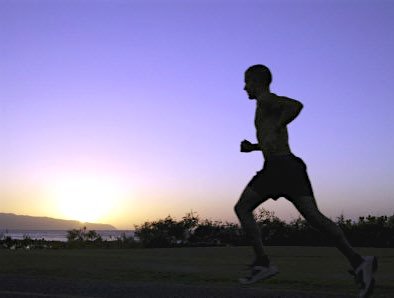
Aerobic exercise: Activities like jogging or cycling, relying on sustained oxygen delivery and oxidative metabolism.
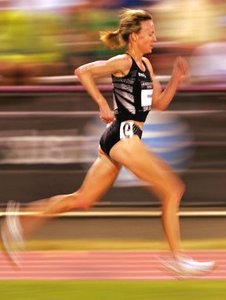
Anaerobic exercise: Short, intense activities such as sprinting or weightlifting, relying on glycolytic and phosphagen pathways.
Flexibility exercise: Activities like stretching or yoga, focusing on joint range of motion and muscle elasticity.
Muscle Fiber Types and Metabolic Pathways
Muscle Fiber Types
Skeletal muscle fibers are specialized for different types of activity and energy utilization.
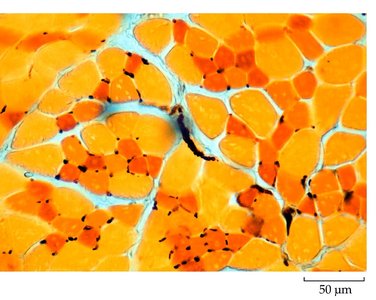
Slow Oxidative (Type I): Fatigue-resistant, high endurance, rich in mitochondria and myoglobin, small diameter.
Fast Oxidative (Type IIa): Intermediate fatigue resistance and speed, moderate mitochondria and myoglobin.
Fast Glycolytic (Type IIb/IIx): Easily fatigued, high twitch speed, large diameter, low mitochondria and myoglobin.
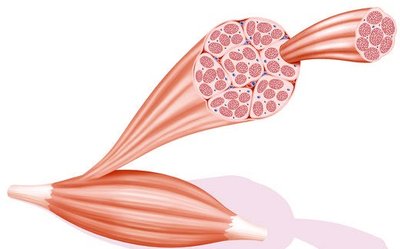
Fiber Type Comparison Table
Characteristic | Slow Oxidative | Fast Oxidative | Fast Glycolytic |
|---|---|---|---|
Twitch Speed | Slow | Intermediate | Fast |
Myosin ATPase | Slow | Intermediate | Fast |
Fiber Diameter | Small | Medium | Large |
Ca2+ Pumps in SR | Fewer | Many | Many |
Endurance | Fatigue Resistant | Fatigue Resistant | Easily Fatigued |
Metabolism | Oxidative | Oxidative | Glycolytic |
Capillary Density | High | Medium | Low |
Mitochondria | High | Medium | Low |
O2 Storage | Myoglobin | Some myoglobin | None |
Metabolic Pathways in Muscle
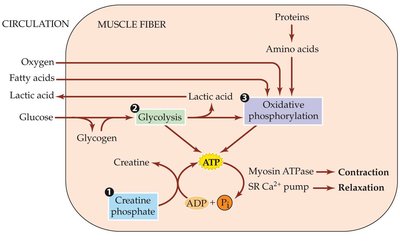
Muscle fibers generate ATP through three main pathways:
Phosphagen system (Creatine phosphate): Provides immediate ATP for short bursts of activity.
Glycolysis: Anaerobic breakdown of glucose, producing ATP and lactic acid.
Oxidative phosphorylation: Aerobic metabolism using oxygen, fatty acids, and glucose for sustained ATP production.
Energy Utilization and Exercise Intensity
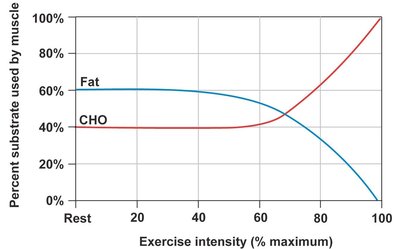
The substrate used for energy shifts with exercise intensity:
At low intensity, fat is the primary fuel.
At high intensity, carbohydrates (CHO) become the dominant substrate.
Energetics of Exercise
Measurement of Energy Expenditure
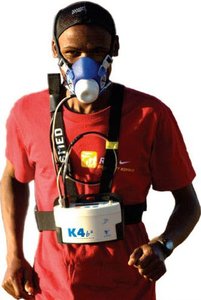
Respirometry: Measures O2 consumption to estimate caloric expenditure. 1L O2 ≈ 5 Cal.
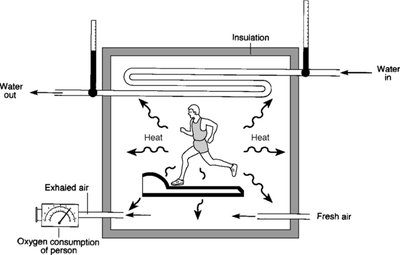
Direct calorimetry: Measures heat production to determine energy output.
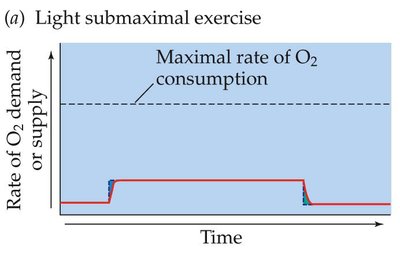
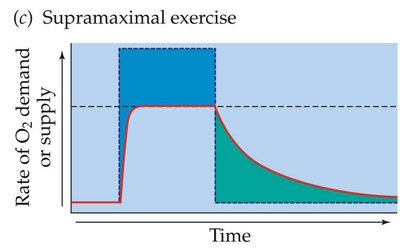
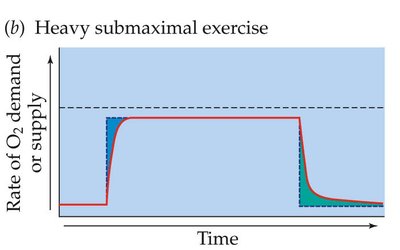
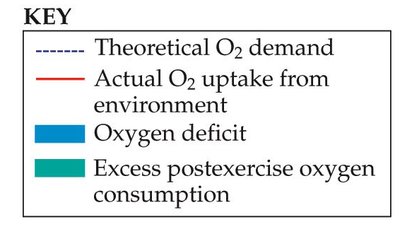
Oxygen Deficit and Excess Post-Exercise Oxygen Consumption (EPOC)
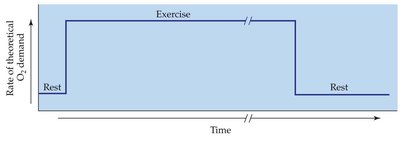
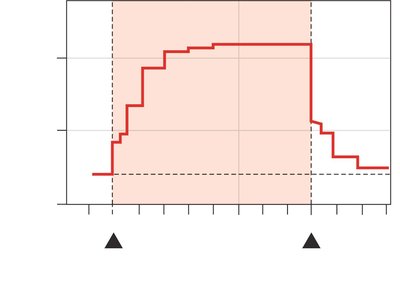
During the onset of exercise, O2 delivery lags behind demand, creating an O2 deficit. After exercise, O2 consumption remains elevated (EPOC) to restore homeostasis.
O2 deficit: Initial period where anaerobic pathways supplement energy needs.
EPOC: Recovery phase where aerobic metabolism replenishes energy stores and clears metabolites.
Respiratory and Cardiovascular Responses
Ventilatory Response to Exercise
Ventilation increases rapidly at the onset of exercise to meet increased O2 demand and remove CO2.
During submaximal exercise, blood gases and pH remain relatively stable due to efficient respiratory compensation.
O2 Transport and Hemoglobin Binding
O2 is transported in blood bound to hemoglobin (Hb).
Changes in pH and CO2 concentration shift the Hb-O2 binding curve:
Alkaline pH (low CO2): Shifts curve left, increases O2 affinity.
Acidic pH (high CO2): Shifts curve right, decreases O2 affinity.
Cardiac Output and Blood Distribution
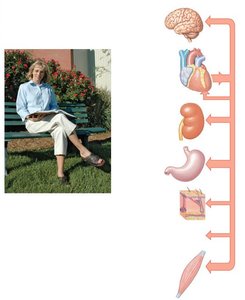
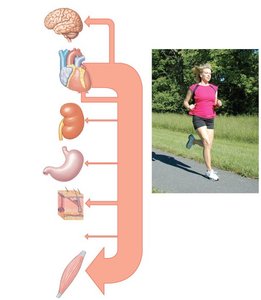
Cardiac output increases significantly during exercise, redistributing blood flow to active skeletal muscles.
At rest, organs like the brain, kidneys, and GI tract receive more blood; during strenuous exercise, skeletal muscles receive the majority.
Blood Pressure Regulation During Exercise
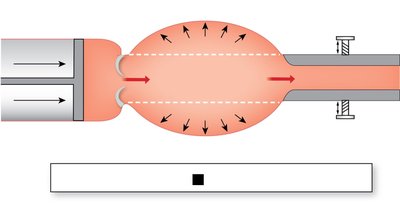
Blood pressure rises due to increased cardiac output and changes in peripheral resistance.
Mean arterial pressure (MAP) is determined by the equation:
During exercise, vasodilation in active muscles reduces resistance, moderating the increase in MAP.
Acute vs Chronic Adaptations to Exercise
Acute Responses
Immediate increases in heart rate, stroke volume, ventilation, and energy substrate utilization.
Temporary shifts in blood flow and metabolic activity.

Chronic Adaptations (Endurance Training)
Repeated exposure to exercise leads to lasting physiological changes:
Muscle: Increased proportion of oxidative fibers, decreased glycolytic fibers, increased capillary density, reduced fiber diameter, and enhanced blood flow.
Blood: Increased total blood volume, plasma volume, and hematocrit volume; decreased hematocrit proportion and blood viscosity.
Heart: Increased left ventricle thickness, contractility, and stroke volume.
Lungs: Slight increase in total lung capacity, decrease in residual volume, increase in vital capacity, and significant increase in tidal volume during exercise.
VO2 max: Higher maximal oxygen consumption, reduced O2 debt, and improved recovery (EPOC).
Summary Table: Acute vs Chronic Exercise Responses
Parameter | Acute Response | Chronic Adaptation |
|---|---|---|
Heart Rate | Increases | Lower at rest, higher max |
Stroke Volume | Increases | Increases |
Blood Flow | Redistributed to muscles | Enhanced muscle perfusion |
Muscle Fiber Type | Recruitment based on intensity | More oxidative fibers |
Capillary Density | No change | Increases |
VO2 max | Limited by fitness | Increases |
Lung Capacity | Increases during exercise | Slight increase |
Key Terms and Concepts
Oxygen deficit: The gap between O2 demand and supply at exercise onset.
EPOC: Excess post-exercise oxygen consumption, reflecting recovery needs.
VO2 max: Maximal rate of O2 consumption, indicator of aerobic fitness.
Cardiac output: Volume of blood pumped by the heart per minute.
Mean arterial pressure (MAP): Average blood pressure in arteries during one cardiac cycle.
Conclusion
Understanding the physiological responses to exercise is essential for optimizing health, performance, and recovery. Both acute and chronic adaptations involve complex interactions between the cardiovascular, respiratory, and muscular systems, with significant implications for energy metabolism and substrate utilization.