 Indietro
Relations and Functions: Foundations for Algebraic Graphing and Analysis
Guida di studio - Note intelligenti
 Appunti personalizzati basati sui tuoi materiali, ampliati con definizioni chiave, esempi e contesto.
Relations and Functions
Definition of Relations and Functions
Understanding the concepts of relations and functions is fundamental in algebra. These concepts help describe how variables interact and are essential for graphing and analyzing equations.
Relation: A relation is a set of ordered pairs, typically written as (x, y), where x is the independent variable and y is the dependent variable.
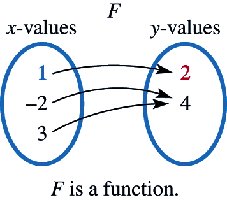
Function: A function is a special type of relation in which each value of the independent variable (x) is paired with exactly one value of the dependent variable (y).
Example: If F = {(1, 2), (–2, 4), (3, 4)}, F is a function because each x-value is paired with only one y-value.
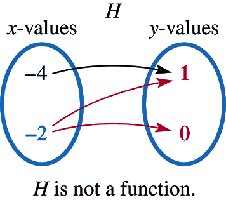
Counterexample: If H = {(–4, 1), (–2, 1), (–2, 0)}, H is not a function because the x-value –2 is paired with two different y-values (1 and 0).
Domain and Range
The domain of a relation is the set of all possible values of the independent variable (x), while the range is the set of all possible values of the dependent variable (y).
Domain: All x-values in the set of ordered pairs.
Range: All y-values in the set of ordered pairs.
Example: For the relation {(3, –1), (4, 2), (4, 5), (6, 8)}, the domain is {3, 4, 6} and the range is {–1, 2, 5, 8}. This is not a function because 4 is paired with two different y-values.
Determining Functions from Graphs and Ordered Pairs
To determine if a relation is a function, check that each x-value corresponds to only one y-value. This can be done using the vertical line test on a graph: if any vertical line intersects the graph more than once, the relation is not a function.
Vertical Line Test: If every vertical line intersects the graph at most once, the graph represents a function.
Function Notation
Functions are often written using function notation: . Here, f is the name of the function, x is the independent variable, and f(x) is the value of the function at x (the dependent variable).
Example: If , then .
Caution: The notation does not mean "f times x"; it means the value of the function f at x.
Finding Expressions for Functions
To express y as a function of x from an equation, solve for y and then replace y with .
Step 1: Solve the equation for y.
Step 2: Replace y with .
Increasing, Decreasing, and Constant Functions
A function can be classified based on how its output changes as the input increases:
Increasing: whenever .
Decreasing: whenever .
Constant: for all in the interval.
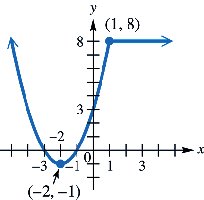
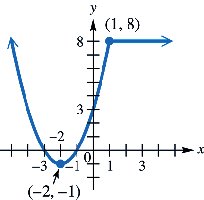
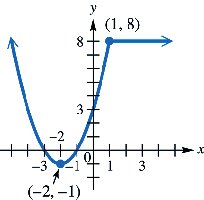
Example: Consider the graph below. The function is decreasing on , increasing on , and constant on .
Interpreting Graphs in Context
Graphs can be used to model real-world situations, such as the water level in a swimming pool over time. By analyzing the graph, we can answer questions about maximum values, intervals of increase or decrease, and describe events that cause changes in the graph.
Example: The graph below shows the number of gallons of water in a pool over time. The water level increases, remains constant, decreases, and then remains constant again.
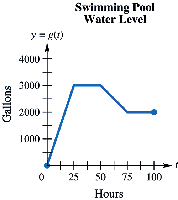
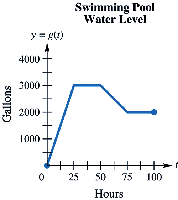
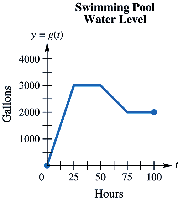
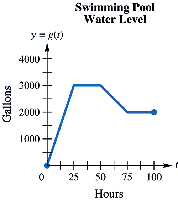
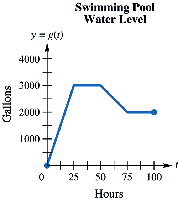
Interpretation: The maximum water level is 3000 gallons, first reached at 25 hours. The water level increases for 25 hours, is constant for 50 hours, decreases for 25 hours, and is constant again for the remaining time. This could represent filling, maintaining, draining, and then maintaining the pool at a lower level.
Summary Table: Key Properties of Relations and Functions
Concept | Definition | How to Identify |
|---|---|---|
Relation | Set of ordered pairs (x, y) | List, table, graph, or mapping diagram |
Function | Relation where each x has exactly one y | No repeated x-values; passes vertical line test |
Domain | All possible x-values | List all x-values from pairs or graph |
Range | All possible y-values | List all y-values from pairs or graph |
Function Notation | Replace x with value to find y |
