 Indietro
Citric Acid Cycle and Electron Transport Chain: Study Notes for General Biology
Guida di studio - Note intelligenti
 Appunti personalizzati basati sui tuoi materiali, ampliati con definizioni chiave, esempi e contesto.
The Citric Acid Cycle (Krebs Cycle)
Overview and Significance
The citric acid cycle, also known as the Krebs cycle or tricarboxylic acid (TCA) cycle, is a central metabolic pathway that completes the oxidation of glucose derivatives, generating high-energy electron carriers and ATP. It occurs in the mitochondrial matrix of eukaryotic cells and is essential for cellular respiration.
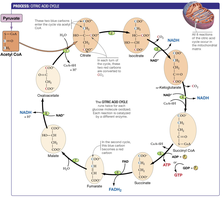
Purpose: Oxidizes acetyl CoA to CO2, producing NADH, FADH2, and ATP/GTP.
Location: Mitochondrial matrix in eukaryotes; cytoplasm in prokaryotes.
Key Intermediates: Citrate, isocitrate, alpha-ketoglutarate, succinyl-CoA, succinate, fumarate, malate, oxaloacetate.
Entry into the Cycle: Acetyl CoA
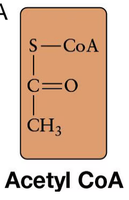
Acetyl CoA is the molecule that enters the citric acid cycle, formed from pyruvate after glycolysis.
Structure: Contains an acetyl group linked to coenzyme A.
Function: Donates the acetyl group to oxaloacetate to form citrate.
Key Steps and Intermediates
The cycle consists of eight main steps, each catalyzed by a specific enzyme.
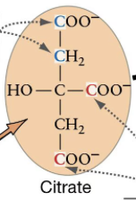
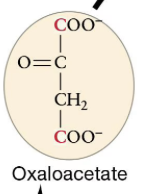
Step 1: Acetyl CoA combines with oxaloacetate to form citrate.
Step 2-8: Citrate is converted through a series of intermediates back to oxaloacetate, releasing CO2 and capturing energy in NADH, FADH2, and ATP/GTP.
Carboxylic Acids: All intermediates are carboxylic acids; adding any one to cells increases respiration rate.
Products per Cycle
For each molecule of pyruvate:
2 CO2
3 NADH
1 FADH2
1 ATP or GTP
For each molecule of glucose (2 pyruvate):
4 CO2
6 NADH
2 FADH2
2 ATP or GTP
Enzyme Types in the Citric Acid Cycle
Most enzymes in the citric acid cycle are dehydrogenases, which catalyze oxidation-reduction reactions, transferring electrons to NAD+ or FAD.
Dehydrogenases: Remove hydrogen atoms and electrons from substrates.
Isomerases: Rearrange molecular structures.
Lyases: Remove or add groups to molecules without hydrolysis.
Regulation of the Citric Acid Cycle
The cycle is tightly regulated to match cellular energy needs.
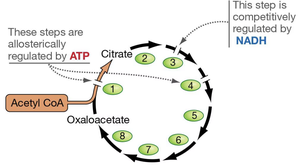
Allosteric Regulation: ATP inhibits key steps, preventing excess energy production.
Competitive Regulation: NADH inhibits certain enzymes, ensuring balance between NAD+ and NADH.
Examples of Intermediates
Citrate: First product formed from acetyl CoA and oxaloacetate.
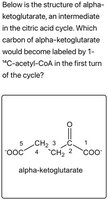
Alpha-ketoglutarate: Intermediate that can be labeled with isotopic acetyl groups.
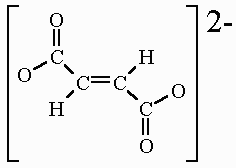
Fumarate: Contains a double bond; involved in later steps of the cycle.
Electron Transport Chain (ETC)
Overview and Function
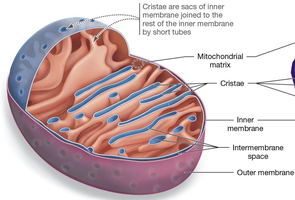
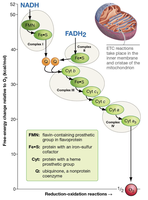
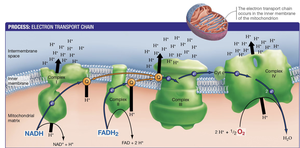
The electron transport chain is a series of protein complexes embedded in the inner mitochondrial membrane. It receives electrons from NADH and FADH2 and transfers them to oxygen, the terminal electron acceptor, generating a proton gradient.
Location: Inner mitochondrial membrane (cristae).
Function: Transfers electrons, pumps protons, and produces ATP.
Mechanism of Electron Transport
Electrons from NADH and FADH2 are passed through complexes I-IV.
Each complex has a higher redox potential than the previous, ensuring directional electron flow.
Energy released is used to pump H+ ions from the matrix to the intermembrane space.
Proton Gradient and ATP Synthesis
The proton gradient across the inner membrane creates a proton-motive force that drives ATP synthesis via the enzyme ATP synthase.
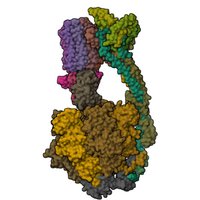
ATP Synthase: Large protein complex that synthesizes ATP as protons flow back into the matrix.
Oxidative Phosphorylation: Process of ATP generation using energy from the proton gradient.
Equation:
Regulation and Inhibition
ATP synthesis halts if the inner membrane is disrupted, as the proton gradient collapses.
Mutations in ATP synthase can prevent ATP production.
Summary of Cellular Respiration
ATP Yield and Variability
Maximum observed ATP yield per glucose: 29 ATP.
Yield depends on electron donor and terminal electron acceptor.
Each NADH can generate up to 3 ATP; each FADH2 up to 2 ATP.
Alternative Substrates and Acceptors
Glucose is not the only substrate; other molecules can enter the cycle.
Oxygen is not the only terminal electron acceptor; alternatives exist in some organisms.
Table: Citric Acid Cycle Intermediates and Products
Step | Intermediate | Product(s) | Enzyme Type |
|---|---|---|---|
1 | Citrate | None | Synthase |
2 | Isocitrate | None | Isomerase |
3 | Alpha-ketoglutarate | NADH, CO2 | Dehydrogenase |
4 | Succinyl-CoA | NADH, CO2 | Dehydrogenase |
5 | Succinate | ATP/GTP | Synthase |
6 | Fumarate | FADH2 | Dehydrogenase |
7 | Malate | None | Hydratase |
8 | Oxaloacetate | NADH | Dehydrogenase |
Table: Electron Transport Chain Complexes
Complex | Electron Donor | Key Prosthetic Group | Function |
|---|---|---|---|
I | NADH | FMN | Transfers electrons, pumps H+ |
II | FADH2 | Fe-S | Transfers electrons, no H+ pumping |
III | Cytochrome b/c1 | Heme | Transfers electrons, pumps H+ |
IV | Cytochrome c | Heme | Transfers electrons to O2, pumps H+ |
Additional info: The notes have been expanded to include definitions, context, and tables for clarity. Images included are directly relevant to the explanation of each paragraph and reinforce the educational content.
