 Indietro
Energy Flow and Nutrient Cycling in Ecosystems: Food Chains, Food Webs, and Productivity
Guida di studio - Note intelligenti
 Appunti personalizzati basati sui tuoi materiali, ampliati con definizioni chiave, esempi e contesto.
Energy Flow in Ecosystems
Gross Primary Productivity (GPP) and Net Primary Productivity (NPP)
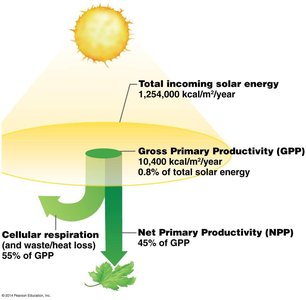
Energy enters ecosystems primarily through sunlight, which is captured by autotrophs (primary producers) via photosynthesis. The total amount of energy captured is called Gross Primary Productivity (GPP). However, a significant portion of this energy is used by plants for cellular respiration, and the remainder is called Net Primary Productivity (NPP), which is available to consumers in the ecosystem.
Gross Primary Productivity (GPP): Total energy captured by producers.
Cellular Respiration: Energy used by producers for metabolic processes.
Net Primary Productivity (NPP): Energy remaining after respiration; available to the rest of the food web.
Formula:
Example: Tropical wet forests have much higher NPP than deserts, supporting greater biodiversity.
Photosynthesis Equation
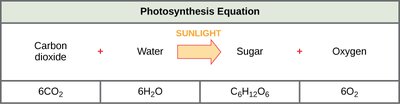
Photosynthesis is the process by which primary producers convert sunlight, carbon dioxide, and water into chemical energy (sugars) and oxygen. This process forms the foundation of energy flow in ecosystems.
Photosynthesis Equation:
Key Terms: Autotrophs (primary producers), photosynthesis, chemical energy
Trophic Structure: Food Chains and Food Webs
Food Chains and Food Webs
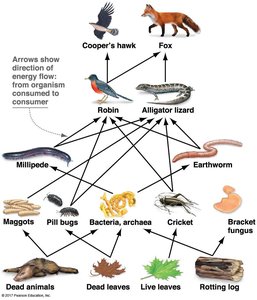
Energy and nutrients move through ecosystems via food chains and food webs. A food chain is a linear sequence of organisms through which energy flows, while a food web is a complex network of interconnected food chains.
Primary Producers: Autotrophs that synthesize food from inorganic sources.
Primary Consumers: Herbivores that eat primary producers.
Secondary Consumers: Carnivores that eat primary consumers.
Tertiary Consumers: Carnivores that eat secondary consumers.
Decomposers: Organisms that feed on dead organic matter and waste.
Pyramid of Productivity
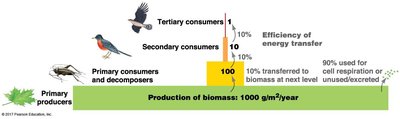
The pyramid of productivity illustrates the decrease in biomass and energy as it moves up trophic levels. Only about 10% of energy is transferred from one level to the next; the rest is lost as heat or used for metabolic processes.
Efficiency of Energy Transfer: Approximately 10% between trophic levels.
Biomass Production: Highest at the base (primary producers), lowest at the top (tertiary consumers).
Example: There are more leaves than crickets, more crickets than songbirds, and more songbirds than hawks.
Distribution and Abundance of Organisms
Latitudinal Biodiversity Gradient and Energy Hypothesis
The abundance and diversity of species in ecosystems are influenced by energy availability. Biomes with higher NPP, such as tropical wet forests, support more species than those with lower NPP, such as deserts.
Latitudinal Biodiversity Gradient: More species are found in regions with higher energy input (closer to the equator).
Energy Hypothesis: Greater NPP leads to greater species richness.
Energy Flow vs. Nutrient Cycling
Energy Flow
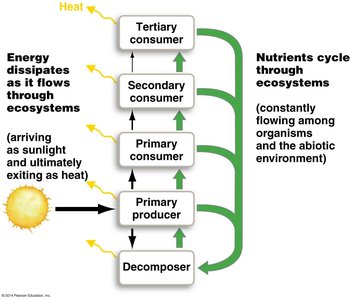
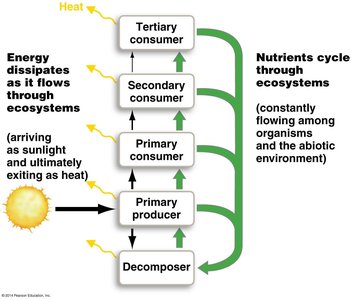
Energy flows through ecosystems in a one-way direction, entering as sunlight and exiting as heat. It is not recycled.
Energy Dissipation: Energy is lost at each trophic level, primarily as heat.
Nutrient Cycling
Nutrients, unlike energy, are recycled within ecosystems. They move through biotic (living) and abiotic (non-living) reservoirs via biogeochemical cycles.
Biogeochemical Cycle: The path an element takes as it moves from abiotic systems through organisms and back again.
Reservoirs: Biotic (plants, animals, fungi, microbes) and abiotic (rocks, water, soil, air).
Processes: Photosynthesis, consumption, respiration, decomposition, weathering, runoff.
Major Biogeochemical Cycles
Carbon Cycle
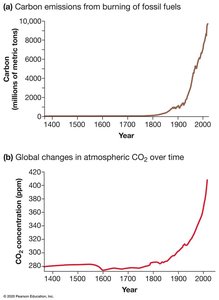
The carbon cycle describes the movement of carbon among major reservoirs: organisms, atmosphere, and oceans. Human activities such as burning fossil fuels and deforestation impact the cycle, increasing atmospheric CO2 and affecting climate.
Major Reservoirs: Organisms, atmosphere (CO2), ocean (dissolved CO2).
Cycling: Photosynthesis (intake), respiration (release), decomposition.
Human Impacts: Burning fossil fuels, deforestation.
Nitrogen Cycle
The nitrogen cycle involves the transformation of nitrogen among various chemical forms and reservoirs. Bacterial nitrogen fixation is crucial for converting atmospheric N2 into forms usable by organisms. Human activities such as agricultural runoff and air pollution disrupt the cycle, leading to issues like eutrophication.
Major Reservoirs: Organisms (nucleic acids, proteins), atmosphere (N2, NH3, NH4+, NO3-).
Cycling: Nitrogen fixation, assimilation, decomposition.
Human Impacts: Air pollution (acid rain), agricultural runoff, eutrophication.
Summary Table: Trophic Levels and Energy Flow
Trophic Level | Role | Energy Source |
|---|---|---|
Primary Producer | Autotroph | Sunlight |
Primary Consumer | Herbivore | Primary Producer |
Secondary Consumer | Carnivore | Primary Consumer |
Tertiary Consumer | Top Carnivore | Secondary Consumer |
Decomposer | Detritivore | Dead organic matter |
Key Takeaways
Energy flows through ecosystems and is lost as heat, while nutrients are recycled.
NPP is a critical measure of ecosystem productivity and biodiversity.
Food webs illustrate complex interactions and energy transfer among organisms.
Human activities significantly impact biogeochemical cycles, especially carbon and nitrogen.
