 Indietro
Enzymes: Structure, Function, and Laboratory Investigation
Guida di studio - Note intelligenti
 Appunti personalizzati basati sui tuoi materiali, ampliati con definizioni chiave, esempi e contesto.
Enzymes: Structure and Function
Definition and Role of Enzymes
Enzymes are biological catalysts, typically proteins, that accelerate chemical reactions in living organisms by lowering the activation energy required for the reaction to proceed. They are not consumed in the reaction and can be reused multiple times.
Catalysts: Molecules that speed up chemical reactions without being consumed.
Activation Energy: The minimum energy required for reactants to form products; enzymes lower this threshold.
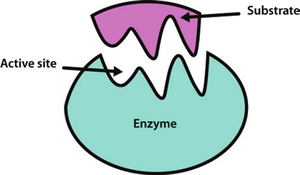
Specificity: Enzymes are highly specific to their substrates due to their unique active sites.
Protein Structure: Enzymes are complex proteins with intricate three-dimensional shapes maintained by various chemical bonds.
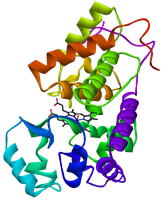
Enzyme Structure and Active Site
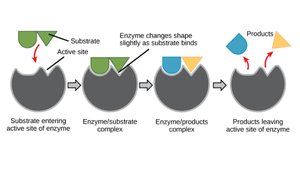
The active site of an enzyme is a region where the substrate binds and undergoes a chemical reaction. The shape and chemical environment of the active site ensure specificity for particular substrates.
Active Site: The region of the enzyme where substrate binding and catalysis occur.
Induced Fit: Binding of the substrate causes the enzyme to change shape slightly, enhancing the fit and facilitating the reaction.
Types of Enzymes
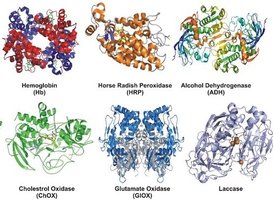
Enzymes vary in structure and function, each catalyzing specific reactions. Examples include oxidases, peroxidases, and dehydrogenases.
Examples: Hemoglobin, Horse Radish Peroxidase, Alcohol Dehydrogenase, Cholesterol Oxidase, Glutamate Oxidase, Laccase.
Enzyme Kinetics and Reaction Rates
Lowering Activation Energy
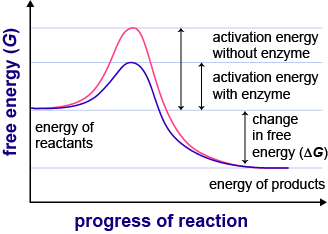
Enzymes facilitate reactions by lowering the activation energy, making it easier for reactants to convert into products. This is illustrated in energy profile diagrams.
Activation Energy (Ea): Reduced in the presence of enzymes.
Free Energy Change (ΔG): Unaffected by enzymes; only the rate is changed.
Effects of Substrate and Enzyme Concentration
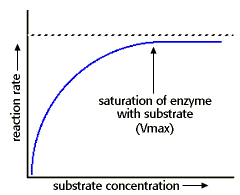
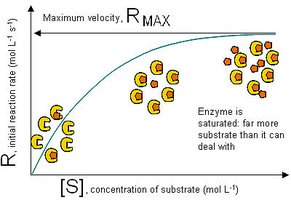
The rate of enzymatic reactions depends on the concentration of both enzyme and substrate. Increasing substrate concentration increases reaction rate until all enzyme molecules are saturated (Vmax).
Enzyme Concentration: More enzyme increases reaction rate, provided substrate is not limiting.
Substrate Concentration: Reaction rate increases with substrate concentration until saturation is reached.
Vmax: Maximum velocity when all enzyme active sites are occupied.
Environmental Effects on Enzyme Activity
Temperature
Temperature affects enzyme activity by influencing molecular kinetic energy. Each enzyme has an optimal temperature range; too low slows reactions, too high causes denaturation.
Low Temperature: Reduced kinetic energy, slower reaction rate.
Optimal Temperature: Highest activity, varies by enzyme.
High Temperature: Denaturation, loss of enzyme function.
pH
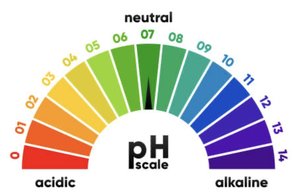
Enzymes function best within a specific pH range, typically 6-8. Deviations from optimal pH reduce activity due to changes in charge and structure.
Optimal pH: Highest activity, varies by enzyme.
Acidic/Alkaline Conditions: Can denature enzymes or alter active site charge.
Salt Concentration
Salt concentration affects enzyme activity by interfering with ionic bonds that maintain protein structure. Most enzymes are intolerant of extreme salinity.
Inorganic Ions: Can disrupt enzyme structure and function.
Enzyme Helpers and Inhibitors
Cofactors and Coenzymes
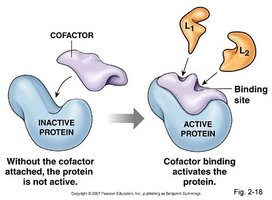
Cofactors are non-protein molecules required for enzyme activity. They may be inorganic ions (e.g., copper, zinc) or organic molecules (coenzymes, often vitamins).
Cofactors: Metallic ions that activate enzymes.
Coenzymes: Organic molecules, often vitamins, that assist enzymes.
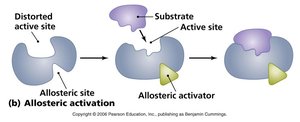
Binding: Cofactors may bind to the active site or allosteric site.
Enzyme Inhibitors
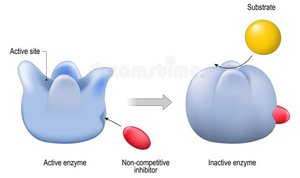
Enzyme inhibitors reduce or prevent enzyme activity. They are classified as competitive or non-competitive based on their mode of action.
Competitive Inhibitors: Compete with substrate for the active site; inhibition can be overcome by increasing substrate concentration.
Non-Competitive Inhibitors: Bind elsewhere (allosteric site), causing conformational change; inhibition cannot be overcome by substrate addition.
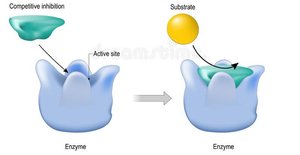
Case Study: Catecholase and Browning Reaction
Catecholase Reaction
Catecholase is an enzyme found in fruits and vegetables that catalyzes the oxidation of catechol in the presence of oxygen, producing benzoquinone. Benzoquinone polymerizes to form melanoid pigments, causing browning.
Catechol: Substrate oxidized to benzoquinone.
Benzoquinone: Colored product responsible for browning.
Aerobic Reaction: Requires oxygen.

Laboratory Investigation: Factors Affecting Enzyme Activity
Experimental Design
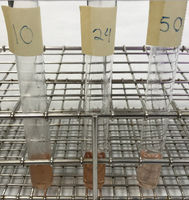
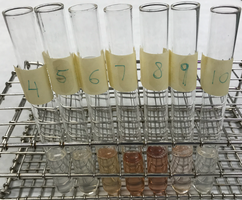
Experiments are conducted to investigate the effects of temperature, pH, enzyme concentration, and substrate concentration on catecholase activity. Each factor is tested using controlled conditions and qualitative/quantitative observations.
Temperature: Record actual temperature used; observe color change as qualitative measure.
pH: Use multiple test tubes to assess activity across pH range.
Enzyme Concentration: Vary amount of enzyme to observe effect on reaction rate.
Substrate Concentration: Vary substrate amount to determine saturation point.
Writing a Scientific Lab Report
Lab Report Structure
A scientific lab report should follow a structured format to ensure clarity and reproducibility. Sections include:
Title: Descriptive and specific, on its own page.
Abstract: Brief summary of purpose, methods, results, and significance (150-200 words).
Introduction: Define enzyme, explain four factors, describe enzyme and reaction, state hypotheses.
Methods: Detailed, past tense, third person, one section per experiment.
Results: Past tense, one table/graph per experiment, highlight key findings.
Discussion: Interpret findings, relate to introduction, state hypothesis acceptance/rejection, discuss applications.
Conclusions: One sentence per factor, bullet points.
References: At least five, only book chapters or scientific journal articles.
Hypotheses
Each factor tested should have a null and alternative hypothesis:
Null Hypothesis: No effect of the factor on enzyme activity.
Alternative Hypothesis: Factor affects enzyme activity.
Results and Data Presentation
Results should be presented in tables or graphs with proper titles, axis labels (including units), and clear identification of independent and dependent variables.
Section | Purpose |
|---|---|
Title | Describes experiment |
Abstract | Summarizes study |
Introduction | Background and hypotheses |
Methods | Experimental procedures |
Results | Data and observations |
Discussion | Interpretation and context |
Conclusions | Summary statements |
References | Sources cited |
Scientific Writing Guidelines
Use third person and past tense (except introduction).
Do not use personal pronouns.
Paraphrase referenced material; no direct quotes.
Proofread and follow formatting instructions.
Key Equations and Concepts
Michaelis-Menten Equation
The rate of enzyme-catalyzed reactions can be described by the Michaelis-Menten equation:
v: Reaction rate
Vmax: Maximum rate
[S]: Substrate concentration
Km: Michaelis constant (substrate concentration at half Vmax)
Activation Energy
Enzymes lower the activation energy barrier:
= Change in free energy (unchanged by enzyme)
= Activation energy (lowered by enzyme)
Summary Table: Factors Affecting Enzyme Activity
Factor | Effect | Optimal Range |
|---|---|---|
Temperature | Increases rate to optimum, then denatures | Varies by enzyme |
pH | Optimal range, extremes denature | Usually 6-8 |
Enzyme Concentration | Increases rate if substrate available | Unlimited (with excess substrate) |
Substrate Concentration | Increases rate to saturation (Vmax) | Until all enzyme active sites occupied |
Additional info: Academic context was added to clarify enzyme kinetics, structure, and lab report writing, ensuring completeness and self-contained study notes.
