 Indietro
General Biology Exam 3 Study Guide – Step-by-Step Guidance
Guida di studio - Note intelligenti
 Appunti personalizzati basati sui tuoi materiali, ampliati con definizioni chiave, esempi e contesto.
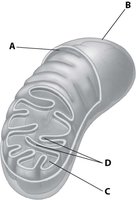
Q24. Label the parts of the mitochondrion
Background
Topic: Cell Structure – Mitochondria
This question tests your knowledge of the structure of mitochondria, an organelle responsible for ATP production in eukaryotic cells. Understanding the internal and external features of mitochondria is essential for explaining their function in cellular respiration.
Key Terms:
Outer membrane: The external boundary of the mitochondrion.
Inner membrane: The membrane inside the mitochondrion, highly folded into cristae.
Cristae: The folds of the inner membrane, increasing surface area for ATP production.
Matrix: The innermost compartment, containing enzymes, mitochondrial DNA, and ribosomes.
Step-by-Step Guidance
Observe the diagram and note the four labeled regions (A, B, C, D). Each label points to a distinct structural feature of the mitochondrion.
Recall that the mitochondrion has two membranes: an outer membrane and a highly folded inner membrane. The folds are called cristae, and the space inside the inner membrane is the matrix.
Identify which label points to the outermost boundary (outer membrane) and which points to the inner membrane or its folds (cristae).
Determine which label indicates the internal space (matrix) and which points to the space between the two membranes (intermembrane space).
Match each label (A, B, C, D) to the correct mitochondrial structure based on their position in the diagram.
Try solving on your own before revealing the answer!
Final Answer:
A: Outer membrane
B: Intermembrane space
C: Matrix
D: Cristae (folds of the inner membrane)
These structures are essential for the mitochondrion's role in energy production. The cristae increase surface area for enzymes involved in ATP synthesis, and the matrix contains the enzymes for the Krebs cycle.
Q43. If you examine side A after three days, you should find...
Background
Topic: Membrane Transport – Diffusion and Osmosis
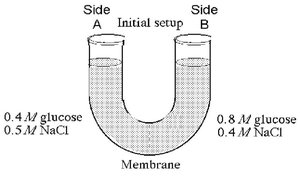
This question tests your understanding of how solutes and water move across a selectively permeable membrane. The scenario involves a U-tube with different concentrations of glucose and sodium chloride (NaCl) on each side, separated by a membrane permeable to NaCl but not to glucose.
Key Concepts:
Selective permeability: The membrane allows NaCl to pass but not glucose.
Diffusion: Movement of solutes from high to low concentration.
Osmosis: Movement of water toward higher solute concentration (lower water potential).
Step-by-Step Guidance
Identify the initial concentrations on both sides: Side A has 0.4 M glucose and 0.5 M NaCl; Side B has 0.8 M glucose and 0.4 M NaCl.
Recall that the membrane is permeable to NaCl but not to glucose. Glucose will stay on its original side, while NaCl can move across the membrane.
Predict the direction of NaCl movement: NaCl will diffuse from the side with higher concentration (Side A) to the side with lower concentration (Side B).
Consider water movement (osmosis): Water will move toward the side with higher total solute concentration (taking into account both glucose and NaCl).
Think about how these movements will affect the concentrations and water levels on Side A after three days.
Try solving on your own before revealing the answer!
Final Answer:
B) a decrease in the concentration of NaCl, an increase in water level, and no change in the concentration of glucose.
NaCl diffuses out of Side A, water enters Side A due to osmosis, and glucose remains unchanged because it cannot cross the membrane.
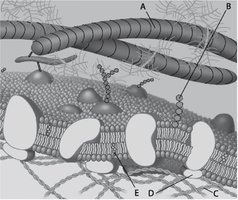
Q45. Which component is cholesterol?
Background
Topic: Cell Membrane Structure
This question asks you to identify cholesterol in a diagram of the plasma membrane. Cholesterol is a lipid molecule that helps regulate membrane fluidity and stability in animal cells.
Key Terms:
Cholesterol: A steroid lipid interspersed among phospholipids in the membrane.
Phospholipid bilayer: The main structural component of the membrane.
Glycolipid: A lipid with a carbohydrate attached, found on the extracellular surface.
Step-by-Step Guidance
Examine the diagram and locate the labeled components (A–E) within the membrane structure.
Recall that cholesterol molecules are typically small, rigid, and embedded within the hydrophobic region of the phospholipid bilayer.
Identify which label points to a molecule that fits the description of cholesterol (short, bulky, and located between phospholipid tails).
Compare the other labeled structures to ensure you are not confusing cholesterol with proteins or glycolipids.
Try solving on your own before revealing the answer!
Final Answer:
C) C
Component C is the cholesterol molecule, shown as a small, rigid structure embedded within the phospholipid bilayer.
Q46. Which component is a glycolipid?
Background
Topic: Cell Membrane Structure
This question asks you to identify a glycolipid in the plasma membrane diagram. Glycolipids are lipids with carbohydrate chains attached, important for cell recognition and signaling.
Key Terms:
Glycolipid: A lipid with a carbohydrate group attached, found on the extracellular surface of the membrane.
Carbohydrate chain: The distinguishing feature of glycolipids, projecting outside the cell.
Step-by-Step Guidance
Look for a structure in the diagram that consists of a lipid embedded in the membrane with a carbohydrate chain extending outward.
Compare the labeled components (A–E) and identify which one fits the description of a glycolipid.
Ensure you are not confusing glycolipids with glycoproteins (proteins with carbohydrate chains attached).
Try solving on your own before revealing the answer!
Final Answer:
B) B
Component B is the glycolipid, as it is a lipid with a carbohydrate chain extending from the membrane surface.
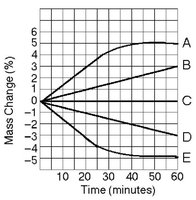
Q47. Which line in the graph represents the bag that contained a solution isotonic to the 0.6 M solution at the beginning of the experiment?
Background
Topic: Osmosis and Tonicity
This question tests your understanding of isotonic solutions and how water moves across a semipermeable membrane. An isotonic solution has the same solute concentration as its environment, resulting in no net movement of water.
Key Terms:
Isotonic: Equal solute concentration inside and outside the bag; no net water movement.
Hypertonic: Higher solute concentration compared to the environment; water moves in.
Hypotonic: Lower solute concentration compared to the environment; water moves out.
Step-by-Step Guidance
Examine the graph and identify the line that shows little or no change in mass over time, indicating no net water movement.
Recall that an isotonic bag will neither gain nor lose water, so its percent mass change should remain around zero.
Compare the lines (A–E) and determine which one stays closest to zero throughout the experiment.
Try solving on your own before revealing the answer!
Final Answer:
C) C
Line C represents the isotonic bag, as it shows no significant change in mass, indicating equal solute concentration inside and outside the bag.
Q48. Which line or lines in the graph represent(s) bags that contain a solution that is still hypertonic at 50 minutes?
Background
Topic: Osmosis and Tonicity
This question asks you to identify which bags remain hypertonic (higher solute concentration inside the bag than outside) after 50 minutes, based on the graph of percent mass change.
Key Terms:
Hypertonic: Solution inside the bag has higher solute concentration than the surrounding solution, causing water to move into the bag (increase in mass).
Step-by-Step Guidance
Look for lines on the graph that show a positive percent change in mass at 50 minutes, indicating water is still entering the bag.
Compare the lines (A–E) and identify which ones are above zero at the 50-minute mark.
These lines represent bags that are still hypertonic relative to the beaker solution.
Try solving on your own before revealing the answer!
Final Answer:
A) A and B
Lines A and B show a positive percent change in mass at 50 minutes, indicating these bags are still hypertonic compared to the surrounding solution.
