 Indietro
Genetic Linkage and Gene Mapping: Study Guide for General Biology
Guida di studio - Note intelligenti
 Appunti personalizzati basati sui tuoi materiali, ampliati con definizioni chiave, esempi e contesto.
Genetic Linkage and Gene Mapping
Inheritance of Linked Genes
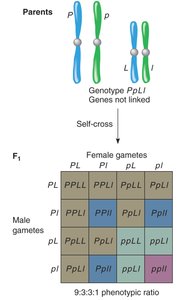
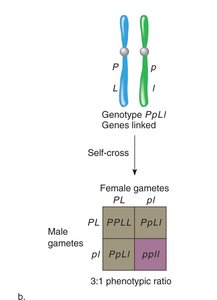
Genes located close together on the same chromosome tend to be inherited together, a phenomenon known as genetic linkage. This contrasts with genes that assort independently, which are either on different chromosomes or far apart on the same chromosome.
Linked genes: Tend to be inherited together due to their proximity on the chromosome.
Independent assortment: Occurs when genes are not linked, resulting in equal likelihood of all allele combinations.
Linkage prevents independent assortment: Linked genes do not follow Mendel's law of independent assortment.
Example: Genes for flower color and pollen shape in plants can be linked or unlinked, affecting inheritance patterns.
Meiosis and Crossing Over
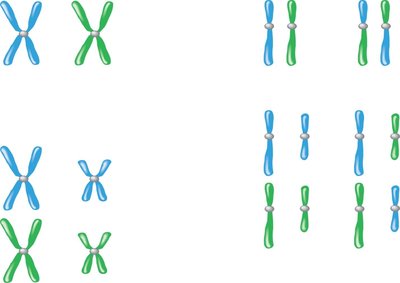
During meiosis, homologous chromosomes can exchange segments in a process called crossing over. This creates recombinant chromosomes with new allele combinations.
Crossing over: Occurs in prophase I of meiosis, resulting in recombinant chromosomes.
Recombinant chromosomes: Have genotypes different from either parent.
Physical distance: The closer two genes are, the less likely crossing over will occur between them.
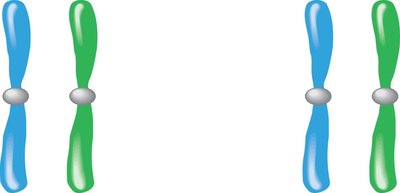
Cis and trans configuration: Cis means both dominant or both recessive alleles are together; trans means one dominant and one recessive allele are paired.


Physical Distance and Crossing Over Probability
The probability of crossing over between two genes depends on their physical distance on the chromosome. Genes farther apart are more likely to recombine.
Genes far apart: Higher probability of crossing over.
Genes close together: Lower probability of crossing over.
Recombination Frequency and Map Units
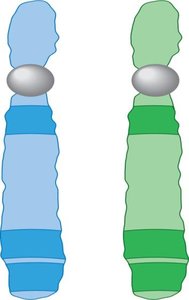
Recombination frequency between two genes can be used to estimate their physical distance, measured in map units or centiMorgans (cM).
Map unit (m.u.): 1% recombination = 1 m.u. or 1 cM.
Recombination frequency: The percentage of recombinant offspring among total offspring.
Formula:
Example: If two genes are 10 cM apart, recombinant gametes are expected 10% of the time.
Determining Gamete Frequencies from Genetic Maps
Genetic maps allow prediction of gamete frequencies based on recombination rates. For genes 10 cM apart, parental gametes are expected 90% of the time, and recombinant gametes 10%.
Parental gametes: More frequent when genes are linked.
Recombinant gametes: Frequency equals the map distance in percent.
Predicting Progeny from a Known Map
Genetic linkage can be used to predict the probability of certain offspring genotypes, such as in the case of Nail Patella Syndrome and blood type, which are 10 cM apart.
Example: Probability of producing a type O child with Nail Patella Syndrome can be calculated using recombination frequency.
Testing for Linkage: Linkage Challenge and Data Analysis
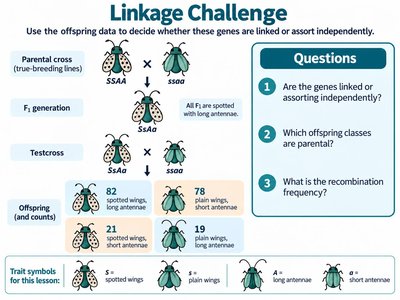
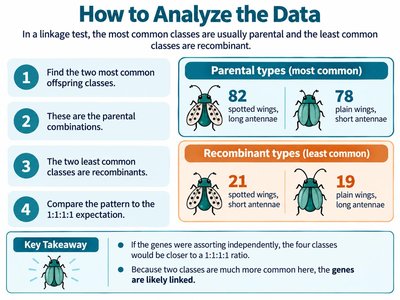
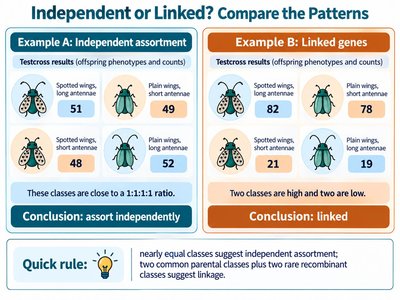
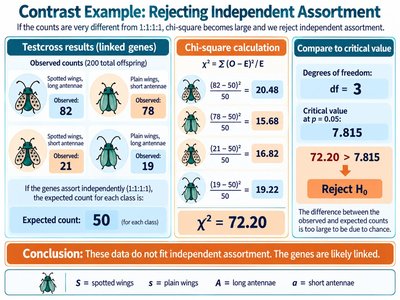
Linkage tests use offspring data to determine whether genes are linked or assort independently. The most common offspring classes are parental, and the least common are recombinant.
Parental types: Most common classes.
Recombinant types: Least common classes.
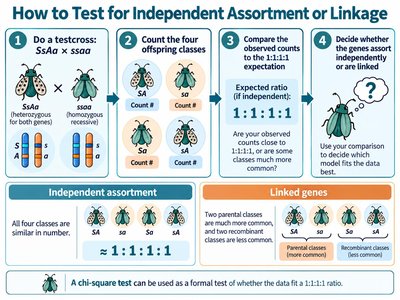
1:1:1:1 ratio: Indicates independent assortment.
Deviation from ratio: Suggests linkage.
Chi-Square Test for Independent Assortment
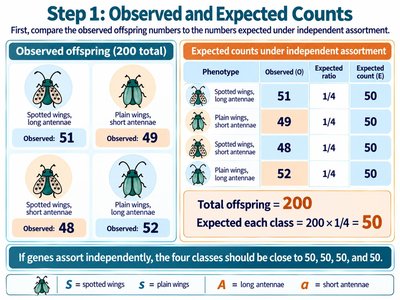
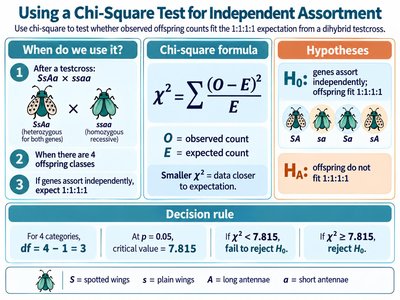
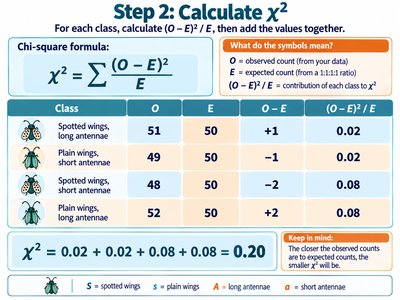
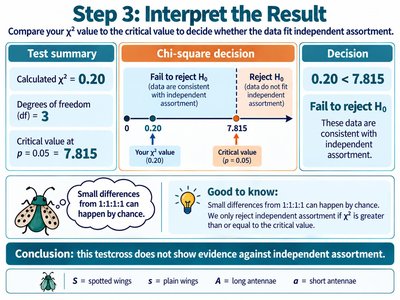
The chi-square test is used to determine whether observed offspring counts fit the expected 1:1:1:1 ratio for independent assortment.
Chi-square formula:
O: Observed count
E: Expected count
Decision rule: If is less than the critical value, fail to reject the null hypothesis (independent assortment).
Gene Mapping Using Recombination Frequency
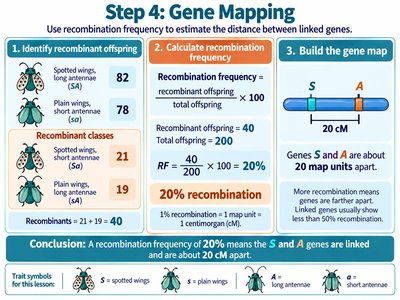
Gene mapping estimates the distance between linked genes using recombination frequency. The higher the frequency, the farther apart the genes are.
Identify recombinant offspring: Least common classes.
Calculate recombination frequency:
Build gene map: Distance in map units (cM).
Summary Table: Linked vs. Independent Genes
Feature | Linked Genes | Independent Genes |
|---|---|---|
Inheritance Pattern | Parental combinations more common | All combinations equally likely |
Recombination Frequency | < 50% | ~50% |
Chi-square Ratio | Deviates from 1:1:1:1 | Fits 1:1:1:1 |
Gene Mapping | Distance measured in cM | Not applicable |
Key Terms and Definitions
Genetic linkage: Tendency of genes close together on a chromosome to be inherited together.
Recombination frequency: Percentage of recombinant offspring, used to estimate gene distance.
Map unit (centiMorgan): Unit of genetic distance; 1 cM = 1% recombination.
Cis/trans configuration: Arrangement of alleles on homologous chromosomes.
Chi-square test: Statistical test to compare observed and expected ratios.
Applications
Gene mapping: Used in research and medicine to locate genes associated with traits or diseases.
Predicting inheritance: Helps estimate probabilities of offspring genotypes in genetic counseling.
Example Calculation
If two genes are 20 cM apart, the recombination frequency is 20%. For 200 offspring, expect 40 recombinant and 160 parental.
Formula:
Example: recombinant offspring.
Additional info: Academic context was added to clarify definitions, formulas, and applications for self-contained study notes.
