 Indietro
Island Biogeography and Population Ecology: Key Concepts and Applications
Guida di studio - Note intelligenti
 Appunti personalizzati basati sui tuoi materiali, ampliati con definizioni chiave, esempi e contesto.
Island Biogeography Theory
Overview of Island Biogeography
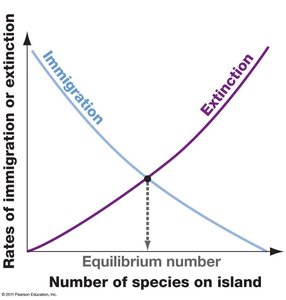
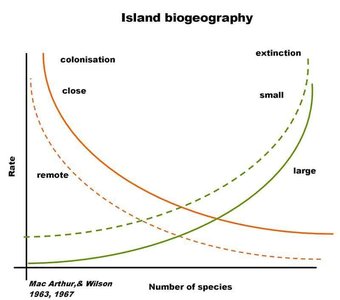
The Theory of Island Biogeography, developed by MacArthur and Wilson, predicts the species richness (number of species) on islands based on immigration and extinction rates. This theory is foundational in understanding how isolated habitats maintain biodiversity and how these dynamics inform conservation strategies.
Immigration: The arrival of new species to an island decreases as the number of existing species increases.
Extinction: The loss of species increases as the number of species increases due to competition and limited resources.
Equilibrium: The predicted number of species is where immigration and extinction rates intersect.
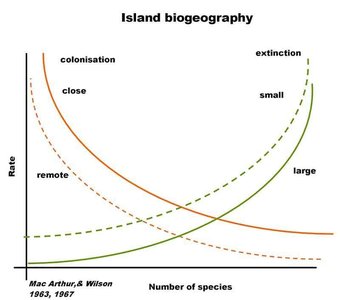
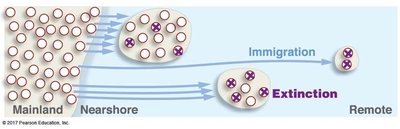
Island Size and Distance: Larger islands and those closer to the mainland have higher immigration rates and lower extinction rates.
Factors Affecting Species Richness
Species richness on islands is determined by the interplay between colonization and extinction rates, which are influenced by island size and proximity to the mainland.
Closer Islands: Higher successful immigration rates.
Remote Islands: Lower successful immigration rates.
Large Islands: Lower extinction rates due to more resources and habitat.
Small Islands: Higher extinction rates due to limited resources.
Applications and Predictions
By comparing islands of different sizes and distances, biologists can predict which islands will support more species. Factors such as habitat, resources, and gene flow also play a role.
More habitat/resources: Supports more species.
Less extinction: Occurs with less competition and more resources.
Gene flow: More likely on islands closer to the mainland.
Latitudinal Gradient in Biodiversity
Patterns and Hypotheses
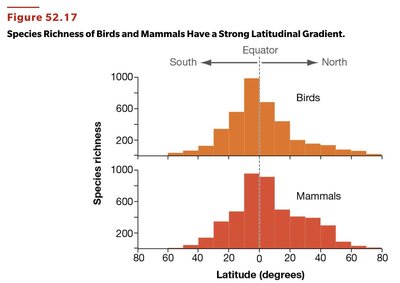
Species diversity is greater at the equator than at the poles. Several hypotheses explain this latitudinal gradient:
Spatial Hypothesis (Abiotic): More surface area, geological stability, and less harsh conditions near the equator.
Energy Hypothesis (Abiotic): Greater solar energy and precipitation at the equator lead to higher net primary productivity.
Ecological Interactions Hypothesis (Biotic): Higher complexity of species interactions and greater niche availability.
Evolutionary History Hypothesis (Biotic): Higher speciation rates, lower extinction rates, and greater immigration into equatorial regions.
Population Ecology
Definition and Scope
Population ecology is the study of how and why the number of individuals in a population changes over time. It uses analytical tools to understand population size, age-class distribution, and to design management strategies for conservation and control of invasive species.
Population: Group of individuals of the same species in the same area at the same time.
Demography: Study of population size and structure through time.
Population Growth Rates and Curves
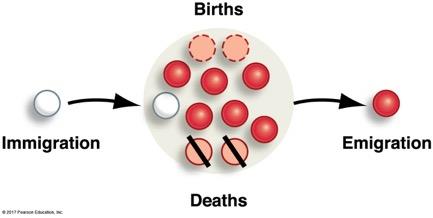
Population growth is determined by birth rates, death rates, immigration, and emigration. For theoretical models, immigration and emigration are often assumed to be zero, focusing on birth and death rates.
Growth Rate: Change in the number of individuals (N) per unit time (t).
Per-capita Rate of Increase (r): Difference between birthrate and death rate per individual.
Intrinsic Rate of Increase (rmax): Maximum value of r under ideal conditions (unlimited resources, limited threats).
Population Growth Equation:
Exponential Growth: Occurs under ideal conditions, resulting in rapid population increase.
Logistic Growth: Occurs when resources are limited, leading to a population stabilizing at carrying capacity (K).
Carrying Capacity (K)
Carrying capacity is the maximum population size that an environment can sustain. It varies in time and space depending on resource availability and environmental conditions.
Resource Allocation: Different species allocate resources differently, affecting their growth rates and life histories.
Fitness Trade-offs: Species face trade-offs between survival, reproduction, and growth.
Processes Affecting Population Size
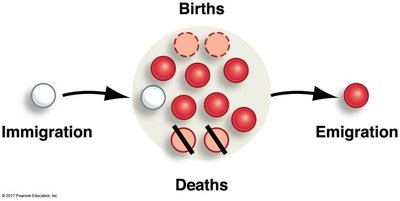
Population size changes due to births, deaths, immigration, and emigration. Growth occurs when births and immigration exceed deaths and emigration; shrinkage occurs when the opposite is true.
Births: Increase population size.
Deaths: Decrease population size.
Immigration: Increase population size.
Emigration: Decrease population size.
Summary Table: Island Biogeography Factors
Factor | Effect on Immigration | Effect on Extinction | Predicted Species Richness |
|---|---|---|---|
Island Size (Large) | Higher | Lower | Higher |
Island Size (Small) | Lower | Higher | Lower |
Distance to Mainland (Close) | Higher | Lower | Higher |
Distance to Mainland (Remote) | Lower | Higher | Lower |
Additional info: The above table summarizes the main predictions of the Theory of Island Biogeography regarding how island size and distance affect species richness.
----------------------------------------
