 Indietro
Membrane Transport, Cell Signaling, and Bioenergetics: General Biology Study Guide
Guida di studio - Note intelligenti
 Appunti personalizzati basati sui tuoi materiali, ampliati con definizioni chiave, esempi e contesto.
Membrane Structure and Permeability
Fluid Mosaic Model
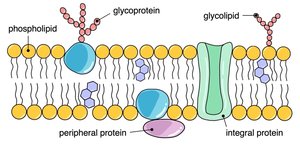
The plasma membrane is a dynamic structure composed of a double layer of phospholipids with embedded proteins, carbohydrates, and other molecules. This arrangement allows the membrane to be flexible and selectively permeable, maintaining cellular integrity and enabling communication between the cell's interior and exterior.
Phospholipids: Form the basic bilayer, with hydrophilic heads facing outward and hydrophobic tails inward.
Proteins: Integral (span the membrane) and peripheral (attached to the surface) proteins perform various functions.
Carbohydrates: Glycoproteins and glycolipids contribute to cell identity and signaling.
Fluidity: Influenced by unsaturated/saturated fatty acids and cholesterol content.
Selective Permeability
Selective permeability is the property of the cell membrane that allows certain molecules or ions to pass through while blocking others. This is essential for maintaining homeostasis and regulating cellular processes.
Small, nonpolar molecules (e.g., O2) pass easily.
Large, polar molecules (e.g., carbohydrates, nucleotides) are blocked.
Water moves slowly, often through specialized channels called aquaporins.
Membrane Proteins
Types and Functions
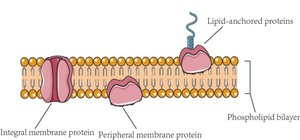
Membrane proteins are crucial for transport, signaling, and structural support. They are classified based on their association with the membrane.
Peripheral proteins: Attached to the membrane surface.
Integral proteins: Embedded within the membrane, including transmembrane proteins.
Functions: Transport, enzyme activity, signal transduction, intercellular joining, cell-cell recognition, attachment to cytoskeleton and extracellular matrix.
Membrane Transport Mechanisms
Passive and Active Transport
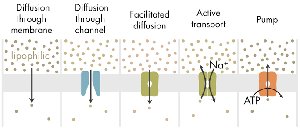
Transport across the membrane occurs via passive (no energy required) or active (energy required) mechanisms. The direction and method depend on the molecule's properties and the concentration gradient.
Passive Transport: Includes diffusion, facilitated diffusion (via channel or carrier proteins), and osmosis.
Active Transport: Requires ATP to move substances against their concentration gradient (e.g., sodium-potassium pump).
Osmosis and Tonicity
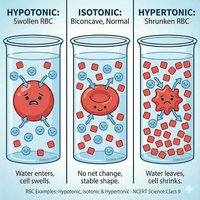
Osmosis is the movement of water across a semipermeable membrane, driven by differences in solute concentration. Tonicity describes the effect of solute concentration on cell volume.
Isotonic: Equal solute concentration inside and outside; cell remains stable.
Hypertonic: Higher solute outside; water leaves cell, causing shrinkage.
Hypotonic: Lower solute outside; water enters cell, causing swelling.
Facilitated Diffusion
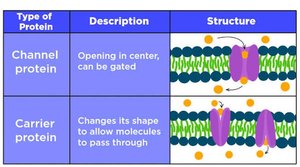
Facilitated diffusion uses channel and carrier proteins to move substances across the membrane without energy input.
Channel proteins: Provide a passageway for molecules.
Carrier proteins: Change shape to transport molecules.
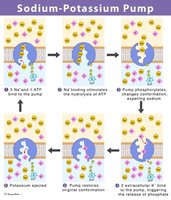
Active Transport: Sodium-Potassium Pump
The sodium-potassium pump is a primary active transport mechanism that maintains cellular ion gradients by moving Na+ out and K+ in, using ATP.
Maintains high K+ inside and high Na+ outside.
Requires ATP for function.
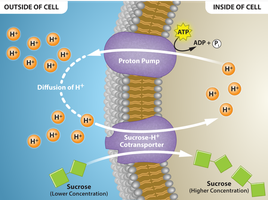
Secondary Active Transport: Proton Pump and Cotransport
Secondary active transport uses the energy stored in ion gradients (often created by primary active transport) to move other substances against their gradient.
Proton pump: Uses ATP to pump H+ out, creating an electrochemical gradient.
Cotransport: Uses the H+ gradient to drive the transport of other molecules (e.g., sucrose).
Bulk Transport: Endocytosis and Exocytosis
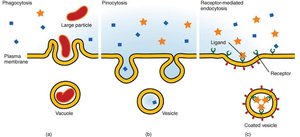
Large molecules are transported via vesicles in processes called endocytosis (into the cell) and exocytosis (out of the cell).
Phagocytosis: Engulfs large particles.
Pinocytosis: Takes in fluid and dissolved solutes.
Receptor-mediated endocytosis: Specific molecules are targeted by receptors.
Cell Communication and Signaling
Stages of Cell Signaling
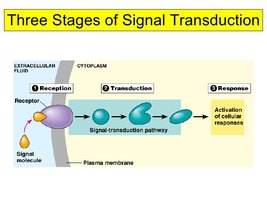
Cell signaling involves three main stages: reception, transduction, and response. These processes allow cells to detect and respond to external signals.
Reception: Signal molecule binds to receptor.
Transduction: Signal is relayed and amplified inside the cell.
Response: Cellular activity is altered, often through changes in gene expression.
Signal Reception: Ligand-Gated Ion Channels
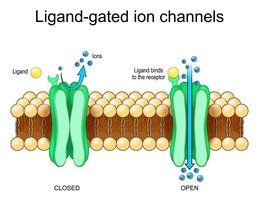
Ligand-gated ion channels are membrane proteins that open in response to the binding of a signaling molecule (ligand), allowing ions to flow into the cell.
Ligand: A molecule that binds to a receptor.
Ion channel receptor: Opens to allow ion passage when ligand binds.
Signal Reception: Intracellular Receptors
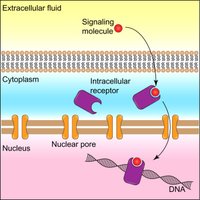
Some signaling molecules are small and nonpolar, allowing them to cross the membrane and bind to receptors inside the cell, often affecting gene expression directly.
Intracellular receptors: Located in the cytoplasm or nucleus.
Example: Steroid hormones.
Bioenergetics and Metabolism
Metabolic Pathways
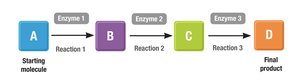
Metabolic pathways are series of enzyme-catalyzed reactions that convert substrates into products, releasing or storing energy.
Catabolic pathways: Break down molecules, releasing energy.
Anabolic pathways: Build molecules, requiring energy.
Energy Transformations and Thermodynamics
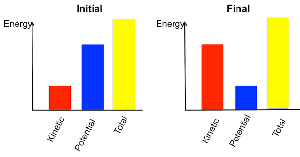
Cells transform energy according to the laws of thermodynamics. Energy can be converted from one form to another, but not created or destroyed. Transformations increase entropy (disorder).
Potential energy: Stored in chemical bonds.
Kinetic energy: Energy of motion.
Exergonic reactions: Release energy; spontaneous.
Endergonic reactions: Require energy input; nonspontaneous.
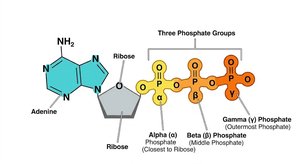
ATP Structure and Function
ATP (adenosine triphosphate) is the primary energy carrier in cells. It consists of a ribose sugar, adenine base, and three phosphate groups. Hydrolysis of ATP releases energy for cellular processes.
ATP hydrolysis equation:
Energy released: Used to drive endergonic reactions.
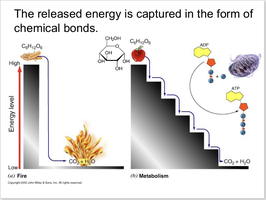
Energy Release: Fire vs. Metabolism
Energy from molecules can be released all at once (fire) or in controlled steps (metabolism), allowing cells to capture energy efficiently.
Metabolism: Stepwise release and capture of energy.
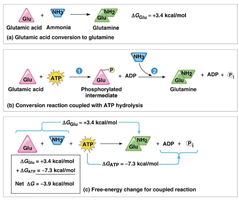
ATP-Coupled Reactions
Cells use ATP hydrolysis to couple and drive nonspontaneous (endergonic) reactions, making them thermodynamically favorable.
Coupled reaction equation:
Enzymes and Catalysis
Enzyme Function and Activation Energy
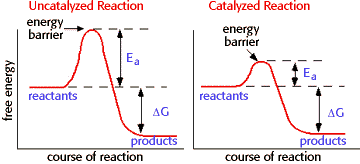
Enzymes are biological catalysts that speed up chemical reactions by lowering the activation energy required. They do not alter the overall free energy change () of a reaction.
Activation energy (): Energy needed to start a reaction.
Enzyme specificity: Each enzyme recognizes a specific substrate.
Enzyme-Substrate Complex
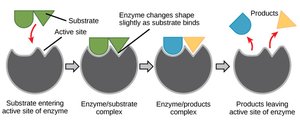
Enzymes bind substrates at their active site, forming an enzyme-substrate complex. The enzyme changes shape slightly to facilitate the reaction, then releases the product.
Lock-and-key model: Substrate fits precisely into the active site.
Induced fit model: Enzyme changes shape for a better fit.
Cellular Respiration
Stages and Outputs
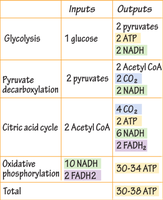
Cellular respiration is the process by which cells extract energy from glucose. It consists of glycolysis, pyruvate oxidation, citric acid cycle, and oxidative phosphorylation.
Glycolysis: Occurs in cytoplasm; produces 2 ATP and 2 NADH.
Pyruvate oxidation: Occurs in mitochondrial matrix; produces 2 NADH and 2 CO2.
Citric acid cycle: Occurs in mitochondrial matrix; produces 2 ATP, 6 NADH, 2 FADH2, and 4 CO2.
Oxidative phosphorylation: Occurs in inner mitochondrial membrane; produces 30-34 ATP.
Stage | Inputs | Outputs |
|---|---|---|
Glycolysis | 1 glucose | 2 pyruvates, 2 ATP, 2 NADH |
Pyruvate decarboxylation | 2 pyruvates | 2 Acetyl CoA, 2 CO2, 2 NADH |
Citric acid cycle | 2 Acetyl CoA | 4 CO2, 2 ATP, 6 NADH, 2 FADH2 |
Oxidative phosphorylation | 10 NADH, 2 FADH2 | 30-34 ATP |
Total | 30-38 ATP |
Photosynthesis
Overview and Location
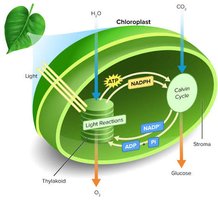
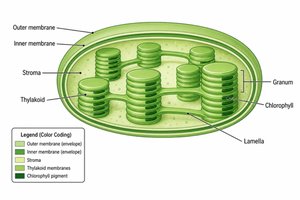
Photosynthesis is the process by which autotrophs convert light energy into chemical energy (glucose). It occurs in chloroplasts, which contain thylakoid membranes for light-dependent reactions and stroma for the Calvin cycle.
Light-dependent reactions: Occur in thylakoid membrane; produce ATP and NADPH.
Calvin cycle (light-independent): Occurs in stroma; uses ATP and NADPH to fix carbon and produce G3P (glucose precursor).
Light Reactions: The Z-Scheme
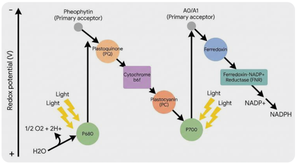
Light reactions involve the excitation of electrons in photosystems II and I, splitting water, and generating a proton gradient for ATP synthesis. Electrons are transferred to NADP+ to form NADPH.
Photosystem II: Absorbs light, splits water, transfers electrons.
Photosystem I: Reenergizes electrons, reduces NADP+ to NADPH.
ATP synthase: Uses proton gradient to produce ATP.
Calvin Cycle (Light-Independent Reactions)
The Calvin cycle uses ATP and NADPH from light reactions to fix CO2 and produce G3P, which is used to synthesize glucose. Rubisco is the key enzyme for carbon fixation.
Carbon fixation: CO2 + RuBP → 3-phosphoglycerate (3PG).
Reduction: 3PG is converted to G3P using ATP and NADPH.
Regeneration: G3P is used to regenerate RuBP.
Photorespiration and Adaptations
Rubisco can bind O2 instead of CO2, leading to photorespiration, which reduces photosynthetic efficiency. C4 and CAM plants have adaptations to minimize photorespiration.
C4 plants: Spatial separation of carbon fixation and Calvin cycle.
CAM plants: Temporal separation; fix CO2 at night, Calvin cycle during the day.
