 Indietro
Phylogenies and the History of Life: Study Notes for General Biology
Guida di studio - Note intelligenti
 Appunti personalizzati basati sui tuoi materiali, ampliati con definizioni chiave, esempi e contesto.
Chapter 25: Phylogenies and the History of Life
Introduction to Life's History
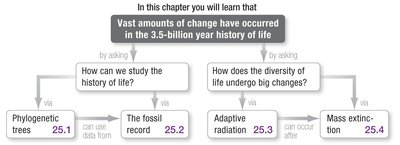
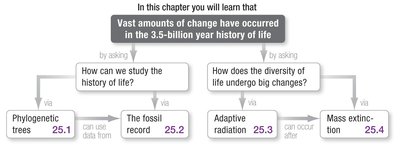
The study of life's history involves understanding vast evolutionary changes over billions of years. Biologists use several tools to investigate these changes, including phylogenetic trees, the fossil record, adaptive radiation, and mass extinction events.
25.1 Tools for Studying Life’s History: Phylogenetic Trees
Anatomy of a Phylogenetic Tree
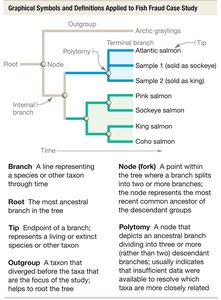
Phylogenetic trees are diagrams that represent evolutionary relationships among species or other taxa. They are hypotheses that can be tested and refined using various types of data.
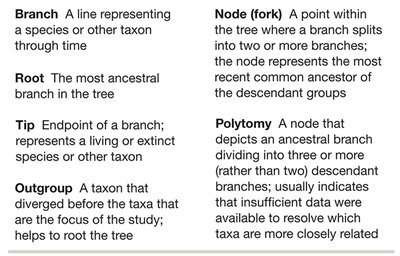
Branch: Represents a species or taxon through time.
Root: The most ancestral branch in the tree.
Tip: Endpoint of a branch; represents a living or extinct species.
Outgroup: A taxon that diverged before the taxa under study; helps root the tree.
Node (fork): Point where a branch splits; represents the most recent common ancestor of descendant groups.
Polytomy: Node dividing into three or more branches, indicating unresolved relationships.
Monophyletic vs Non-monophyletic Groups
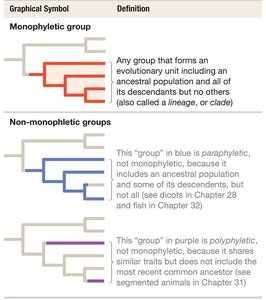
Phylogenetic trees help classify groups based on evolutionary relationships.
Monophyletic group: Includes an ancestor and all its descendants (also called a clade).
Paraphyletic group: Includes an ancestor and some, but not all, descendants.
Polyphyletic group: Includes taxa with similar traits but not the most recent common ancestor.
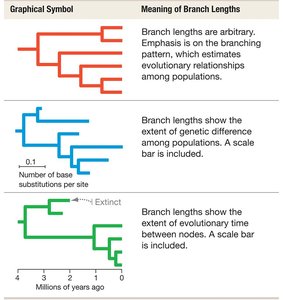
Branch Lengths in Phylogenetic Trees
Branch lengths can represent different types of information depending on the tree:
Arbitrary: Emphasizes branching pattern only.
Genetic difference: Shows extent of genetic change (with scale bar).
Evolutionary time: Shows time between nodes (with scale bar).
Constructing Phylogenetic Trees
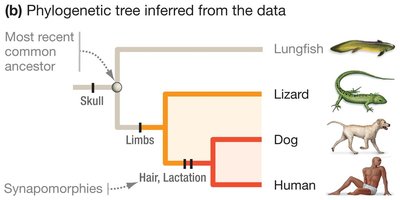
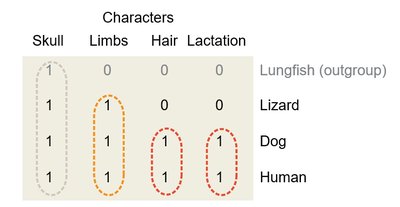
Tree construction begins with a data matrix of trait presence/absence. Synapomorphies (shared derived traits) are used to define monophyletic groups. Parsimony is often used: the simplest explanation requiring the fewest evolutionary changes is preferred.
Synapomorphy: Trait found in two or more taxa, present in their most recent common ancestor, but missing in more distant ancestors.
Parsimony: The most likely tree is the one requiring the fewest changes.
Homoplasy and Complications in Tree Estimation
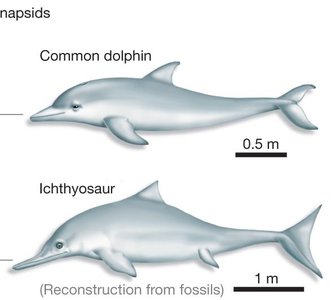
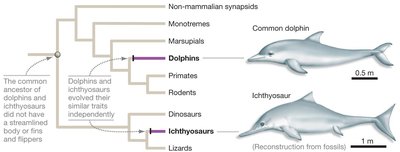
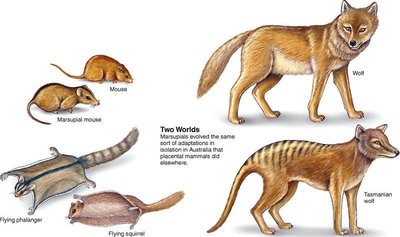
Homoplasy occurs when traits evolve independently in unrelated lineages, often due to similar selection pressures (convergent evolution). Traits may also be gained and lost within a lineage, complicating tree construction.
Homoplasy: Similarities not due to shared ancestry.
Convergent evolution: Independent evolution of similar traits in different lineages.

Whale Evolution: Using Multiple Data Sets
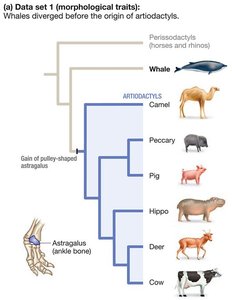
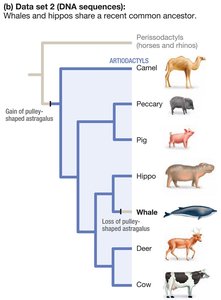
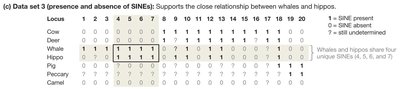
Phylogenetic trees can answer questions about evolutionary relationships, such as the placement of whales. Morphological, DNA, and SINE (short interspersed nuclear elements) data provide evidence for whales' close relationship with hippos.
Morphological tree: Whales diverged before artiodactyls.
DNA tree: Whales and hippos are sister groups; astragalus trait lost in whales.
SINE data: Whales and hippos share unique SINEs, supporting their close relationship.
25.2 Tools for Studying Life’s History: The Fossil Record
Fossils and the Fossil Record
Fossils are physical evidence of organisms from the past, providing direct information about their appearance, environment, and existence. The fossil record is the collection of all fossils ever found.
Types of Information from Fossils
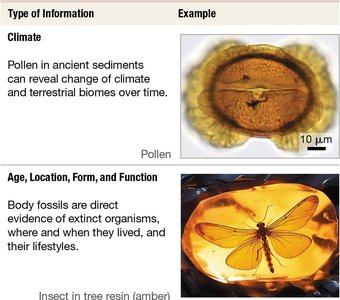
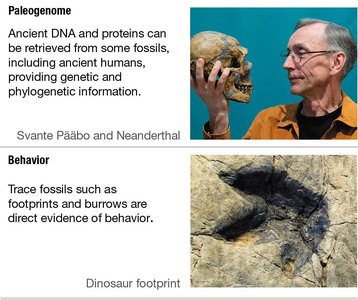
Fossils can reveal climate changes, age, location, form, function, genetic information, and behavior.
Type of Information | Example |
|---|---|
Climate | Pollen in sediments |
Age, Location, Form, Function | Body fossils (e.g., insect in amber) |
Paleogenome | Ancient DNA from fossils |
Behavior | Trace fossils (e.g., footprints) |
Limitations and Biases of the Fossil Record
Fossilization is rare and biased towards certain habitats, taxa, and time periods. The fossil record is a non-random sample but remains the only direct evidence of past life.
Habitat bias: Fossils more likely in beaches, mudflats, swamps.
Taxonomic/tissue bias: Hard parts fossilize more easily.
Temporal bias: Recent fossils more common.
Abundance bias: Common species more likely to be fossilized.
Geologic Time Scale and Major Events
The age of Earth is about 4.6 billion years. Earth history is divided into eons, eras, periods, and epochs. The Precambrian covers most of Earth's history, including the origin of life, oxygenation, first eukaryotes, and first animals. We are currently in the Phanerozoic Eon, Cenozoic Era, Quaternary Period, Holocene Epoch.
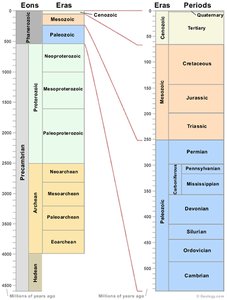
Major Eras of the Phanerozoic Eon
Paleozoic Era (541–252 mya): Diversification of animals, land plants, fungi; ends with Permian extinction.
Mesozoic Era (252–66 mya): Dominance of dinosaurs and gymnosperms; ends with Cretaceous extinction.
Cenozoic Era (66 mya–present): Dominance of mammals, birds, angiosperms; current Holocene Epoch.
25.3 Large-Scale Patterns in Life’s History: Adaptive Radiation
Adaptive Radiation
Adaptive radiation is an evolutionary event where a single lineage rapidly diversifies into many species with varied ecological adaptations. It can be identified in the fossil record or through phylogenetic analysis.
Monophyletic group
Rapid speciation
Diversification into ecological niches
Mechanisms of Adaptive Radiation
Ecological opportunity: New or increased resources.
Trait innovation: Evolution of key traits enabling new resource use or habitats.
The Cambrian Explosion
The Cambrian Explosion was the most significant adaptive radiation in animal history, documented in the fossil record. It led to the emergence of diverse animal lineages with complex bodies and behaviors.
Precambrian animals: Small, soft-bodied, no limbs or shells.
Cambrian animals: Large, diverse, with appendages, skeletons, brains.
Triggers of the Cambrian Explosion
Higher oxygen levels
Higher quality food (algae)
Evolution of predation
New ecological niches
Diversification of Hox genes
25.4 Large-Scale Patterns in Life’s History: Mass Extinction
Mass Extinction Events
Mass extinctions are periods when more than 60% of species disappear within a million years. Five mass extinctions are documented in the fossil record, with a sixth currently underway.
Background extinction: Average rate due to competition, predation, gradual change.
Mass extinction: Sudden, short-lived environmental changes (e.g., volcanic activity, asteroid impact).
End-Permian and End-Cretaceous Extinctions
End-Permian (~252 mya): 90% of species extinct; caused by flood basalts, anoxic oceans, hot atmosphere.
End-Cretaceous (~66 mya): 60–80% of multicellular species extinct; caused by asteroid impact, volcanism, rapid cooling.
Recovery and Selectivity of Extinctions
Extinctions were selective, with some lineages surviving and diversifying. Recovery was slow, taking millions of years.
Extinct vertebrates: Dinosaurs (except birds), pterosaurs, marine reptiles.
Surviving vertebrates: Mammals, crocodiles, amphibians, turtles, birds.
Plants dependent on animal pollinators disappeared; ferns dominated recovery.
The Sixth Mass Extinction
Current extinction rates are 100–1000 times above background rates, caused by habitat loss, pollution, overexploitation, invasive species, and climate change.
Conclusion
Understanding phylogenies, the fossil record, adaptive radiations, and mass extinctions is essential for studying the diversity and history of life. These concepts set the stage for exploring the diversity of life in subsequent units.
