 Indietro
Unit 3 Study Guide: Metabolism, Cellular Respiration, and Photosynthesis
Guida di studio - Note intelligenti
 Appunti personalizzati basati sui tuoi materiali, ampliati con definizioni chiave, esempi e contesto.
Metabolism
Overview of Metabolism
Metabolism encompasses all chemical reactions within an organism, enabling the transformation of matter and energy. These reactions are organized into metabolic pathways, each catalyzed by specific enzymes.
Metabolic Pathway: Series of steps beginning with a specific molecule and ending with a product, each step catalyzed by an enzyme.
Catabolic Pathways: Break down complex molecules into simpler compounds, releasing energy (exergonic, negative ΔG).
Anabolic Pathways: Build complex molecules from simpler ones, requiring energy input (endergonic, positive ΔG).
Laws of Thermodynamics
The laws of thermodynamics govern energy transformations in biological systems.
First Law: Energy can be transferred and transformed, but cannot be created or destroyed (conservation of energy).
Second Law: Every energy transfer increases the entropy (disorder) of the universe; some energy is always lost as heat.
Forms of Energy
Kinetic Energy: Energy of motion.
Potential Energy: Stored energy due to position or structure.
Chemical Energy: Potential energy stored in chemical bonds.
Thermal Energy: Total kinetic energy of particles due to random motion; transferred as heat.
ATP: The Cellular Energy Currency
ATP (Adenosine Triphosphate) is the primary energy carrier in cells, coupling exergonic and endergonic reactions.
Function: Powers cellular work by transferring a phosphate group to other molecules (phosphorylation).
Composition: Adenine (nitrogenous base), ribose (5-carbon sugar), and three phosphate groups.
Mechanism: Hydrolysis of ATP releases energy, driving endergonic reactions.
Enzymes and Catalysis
Enzymes are biological catalysts that speed up metabolic reactions by lowering activation energy barriers.
Enzyme: Catalytic protein that binds to its substrate, forming an enzyme-substrate complex.
Active Site: Region on the enzyme where the substrate binds.
Induced Fit: Enzyme changes shape to optimize substrate binding and catalysis.
Coenzyme: Organic molecule serving as a cofactor (e.g., vitamins).
Cofactor: Nonprotein enzyme helper (often inorganic ions).
Denature: Loss of protein structure and function due to extreme conditions.
Factors Affecting Enzyme Activity
Temperature: Increases reaction rate up to an optimum; high temperatures cause denaturation.
pH: Each enzyme has an optimal pH; extremes disrupt active site conformation.
Substrate/Enzyme Concentration: Reaction rate increases until saturation is reached.
Regulation of Enzyme Activity
Competitive Inhibitors: Bind to the active site, competing with the substrate.
Non-Competitive Inhibitors: Bind to another site, changing enzyme shape and reducing effectiveness.
Allosteric Regulation: Regulatory molecules bind to a separate site, affecting enzyme function.
Activators: Stabilize the active form.
Inhibitors: Stabilize the inactive form.
Feedback Inhibition: End product of a pathway inhibits an enzyme early in the pathway, preventing overproduction.
Cellular Respiration
Overview and Equation
Cellular respiration breaks down glucose to transfer its energy into ATP.
Equation:
Pathway Type: Catabolic and exergonic ( kcal/mol).
Stages of Cellular Respiration
Glycolysis: Occurs in cytosol; breaks down glucose into pyruvate.
Inputs: Glucose, 2 ATP, 2 NAD+
Outputs: 2 pyruvate, 4 ATP (2 net), 2 NADH
Pyruvate Oxidation: Occurs in mitochondrial matrix; converts pyruvate to acetyl-CoA.
Inputs: 2 pyruvate, 2 NAD+, 2 CoA
Outputs: 2 acetyl-CoA, 2 CO2, 2 NADH
Citric Acid Cycle (Krebs Cycle): Occurs in mitochondrial matrix; completes oxidation.
Inputs: 2 acetyl-CoA
Outputs: 6 CO2, 8 NADH, 2 FADH2, 2 ATP
Oxidative Phosphorylation: Occurs in inner mitochondrial membrane; produces most ATP.
Inputs: NADH, FADH2, O2
Outputs: ~32 ATP, 6 H2O
Electron Carriers and ATP Production
NAD+ and NADH: NAD+ accepts electrons, becoming NADH, which carries electrons to the electron transport chain.
FAD and FADH2: FAD accepts electrons during the citric acid cycle, becoming FADH2.
ATP: Produced by substrate-level phosphorylation (glycolysis, citric acid cycle) and oxidative phosphorylation (electron transport chain).
Phosphorylation Types
Substrate-level Phosphorylation: Direct transfer of phosphate to ADP by an enzyme; occurs in glycolysis and citric acid cycle.
Oxidative Phosphorylation: ATP synthesis powered by electron transport chain and chemiosmosis.
ATP Synthase
ATP synthase is a multi-protein enzyme complex in the inner mitochondrial membrane that uses the proton gradient to synthesize ATP from ADP and inorganic phosphate.
Photosynthesis
Overview and Equation
Photosynthesis converts solar energy into chemical energy, sustaining the biosphere.
Equation:
Pathway Type: Anabolic and endergonic ( kcal/mol).
Stages of Photosynthesis
Light Reactions: Occur in thylakoid membranes; split water, release O2, produce ATP and NADPH.
Inputs: Light, H2O
Outputs: O2, ATP, NADPH
Calvin Cycle (Light-Independent Reactions): Occurs in stroma; forms sugar from CO2 using ATP and NADPH.
Inputs: CO2, ATP, NADPH
Outputs: Glucose
Autotrophs vs. Heterotrophs
Autotrophs: Producers; make organic molecules from CO2 and inorganic materials (e.g., plants).
Heterotrophs: Consumers; obtain organic material from other organisms.
Pigments in Photosynthesis
Chlorophyll a: Main photosynthetic pigment; most efficient in blue-violet and red light.
Chlorophyll b: Accessory pigment; broadens absorption spectrum.
Other Accessory Pigments: Absorb different wavelengths and transfer energy to chlorophyll a.
Photophosphorylation
Photophosphorylation is the production of ATP using light energy during photosynthesis, occurring across the thylakoid membrane as a proton gradient powers ATP synthase.
Photorespiration
Photorespiration occurs when rubisco binds O2 instead of CO2, consuming ATP and releasing CO2 without producing sugar, thus reducing photosynthetic efficiency.
C3, C4, and CAM Plants: Comparison and Adaptations
Plants have evolved different strategies to optimize photosynthesis under varying environmental conditions.
C3 Plants:
Initial CO2 fixation produces a 3-carbon compound (3-PGA) via rubisco.
Vulnerable to photorespiration on hot, dry days when stomata close.
More efficient in cool, moist climates.
C4 Plants:
Spatial separation: CO2 is first fixed into a 4-carbon compound in mesophyll cells, then transferred to bundle-sheath cells for the Calvin cycle.
Minimizes photorespiration; efficient in high light and temperature.
Examples: Corn, sugarcane.
CAM Plants:
Temporal separation: Stomata open at night to fix CO2 into organic acids, which release CO2 for the Calvin cycle during the day.
Adapted to arid conditions; minimizes water loss.
Examples: Cacti, pineapples.
Comparison Table: C3, C4, and CAM Plants
Feature | C3 | C4 | CAM |
|---|---|---|---|
Initial CO2 Fixation | 3-carbon compound (3-PGA) | 4-carbon compound (oxaloacetate) | 4-carbon compound (organic acids) |
Photorespiration | High | Low | None |
Adaptation | Cool, moist climates | Hot, sunny climates | Arid climates |
Stomata Behavior | Open during day | Open during day | Open at night |
Examples | Rice, wheat | Corn, sugarcane | Cacti, pineapples |
Venn Diagram: C3, C4, and CAM Plants
The following image visually compares the similarities and differences among C3, C4, and CAM plants, highlighting their carbon fixation strategies and adaptations to environmental conditions.
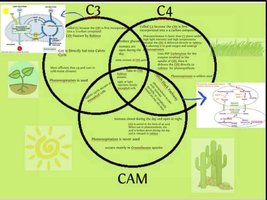
Similarity: All take in CO2 and use rubisco; light reactions occur mostly in mesophyll cells.
Difference: C4 uses spatial separation, CAM uses temporal separation; C3 is vulnerable to photorespiration, C4 and CAM minimize it.
Trade-off: CO2 in = H2O out (plants must balance carbon gain with water loss).
Additional info: The Venn diagram image directly illustrates the comparison and contrast of C3, C4, and CAM plant strategies, reinforcing the textual explanation above.
