 Indietro
Business Statistics Study Guide: Chapters 1–4 (MAT 137)
Guida di studio - Note intelligenti
 Appunti personalizzati basati sui tuoi materiali, ampliati con definizioni chiave, esempi e contesto.
Provided Formulas
Key Statistical Formulas
Understanding and applying statistical formulas is essential for analyzing data in business statistics. Below are the main formulas you need to know for Test 1:
Sample Variance: Measures the average squared deviation from the mean in a sample.
Expected Value (Discrete Random Variable): The mean value expected from a probability distribution.
Variance (Discrete Random Variable): Measures the spread of a probability distribution.
Chapter 1: Statistics, Data, and Statistical Thinking
Descriptive vs. Inferential Statistics
Statistics is divided into two main branches: descriptive and inferential statistics.
Descriptive Statistics: Uses numerical and graphical methods to summarize and present information from a data set.
Inferential Statistics: Uses sample data to make estimates, predictions, or generalizations about a population.
Key Definitions
Experimental Unit: The object or entity being studied.
Population: The complete set of units under investigation.
Variable: A characteristic or property measured or observed.
Sample: A subset of the population selected for analysis.
Types of Data
Quantitative Data: Numerical values (e.g., income, age).
Qualitative Data: Non-numerical categories (e.g., political party, breed).
Chapter 2: Methods for Describing Sets of Data
Frequency Distributions and Histograms
Frequency distributions and histograms are used to organize and visualize data.
Class: Categories for qualitative data or intervals for quantitative data.
Class Frequency: Number of observations in a class.
Class Relative Frequency: Class frequency divided by total observations.
Class Percentage: Relative frequency multiplied by 100.
Measures of Central Tendency
Mean: Arithmetic average of a data set.
Median: Middle value when data is ordered.
Skewness and Symmetry
Skewed Right: Mean > Median
Skewed Left: Mean < Median
Symmetrical: Mean = Median
Range, Variance, and Standard Deviation
Range: Difference between largest and smallest values.
Sample Variance: Measures variability in a sample.
Sample Standard Deviation: Positive square root of sample variance.
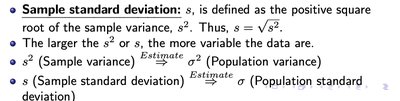
The larger the variance or standard deviation, the more variable the data are. Sample statistics (s, s²) are used to estimate population parameters (σ, σ²).
Empirical Rule
68% of data falls within 1 standard deviation of the mean.
95% within 2 standard deviations.
99.7% within 3 standard deviations.
Z-Scores
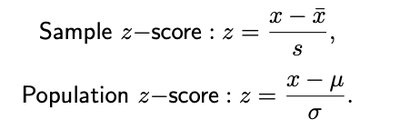
Z-scores measure how many standard deviations a value is from the mean.
Sample z-score:
Population z-score:
Percentiles
The pth percentile is the value below which p% of the data falls.
Example: 90th percentile means 90% of data is below that value.
Chapter 3: Probability
Basic Probability Concepts
Probability quantifies the likelihood of events occurring in an experiment.
Probability: A number between 0 and 1 representing the chance of an event.
Experiment: A process that leads to a single, unpredictable outcome.
Sample Point: The most basic outcome of an experiment.
Sample Space: The set of all possible sample points.
Event: A specific collection of sample points.
Probability Rules
All sample point probabilities must be between 0 and 1.
The sum of all sample point probabilities in a sample space must equal 1.
Finding Probabilities
Probability of an event is its relative frequency in repeated experiments.
Example: Flipping a fair coin, probability of heads = 0.5.
Set Operations and Complements
The probability of complementary events sums to 1.
Chapter 4: Random Variables and Probability Distributions
Random Variables
A random variable assigns numerical values to outcomes of an experiment.
Discrete Random Variable: Takes countable values.
Continuous Random Variable: Takes values in intervals (uncountable).
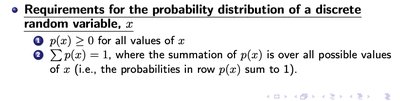
Probability Distribution Requirements
for all values of x
(sum over all possible values of x)
Expected Value and Variance
Expected Value (Mean):
Variance:
Binomial Distribution
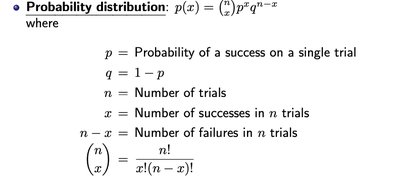
The binomial distribution models the number of successes in a fixed number of independent trials, each with the same probability of success.
Characteristics:
n identical trials
Two possible outcomes per trial: success (S) or failure (F)
Probability of success (p) remains constant
Trials are independent
Probability Distribution Formula: where , = number of trials, = number of successes,
Mean, Variance, and Standard Deviation of Binomial Distribution
Mean:
Variance:
Standard Deviation:
Excel Functions for Binomial Distribution
BINOM.DIST Function
BINOM.DIST(a, n, p, TRUE): Computes cumulative probability of up to a successes in n trials.
BINOM.DIST(a, n, p, FALSE): Computes probability of exactly a successes in n trials.
Arguments:
a: Number of successes
n: Number of trials
p: Probability of success
