 Indietro
Discrete Probability Distributions: Study Notes for Business Statistics
Guida di studio - Note intelligenti
 Appunti personalizzati basati sui tuoi materiali, ampliati con definizioni chiave, esempi e contesto.
Discrete Probability Distributions
Introduction to Discrete Probability Distributions
Discrete probability distributions are fundamental in business statistics, describing the likelihood of various outcomes for random variables that can take on distinct, separate values. Understanding these distributions enables business professionals to make informed decisions based on data-driven probabilities.
Random Variable: A variable whose value is determined by the outcome of a random experiment.
Discrete Random Variable: Assumes a countable number of values (e.g., number of complaints per day, number of TVs in a household).
Continuous Random Variable: Can take any value within a range (uncountable infinite values).
Examples of Discrete Random Variables:
Number of bedrooms in a house
Number of rings before a phone is answered
Binary outcomes: defective/not defective, win/loss, male/female
Probability Distribution of a Discrete Random Variable
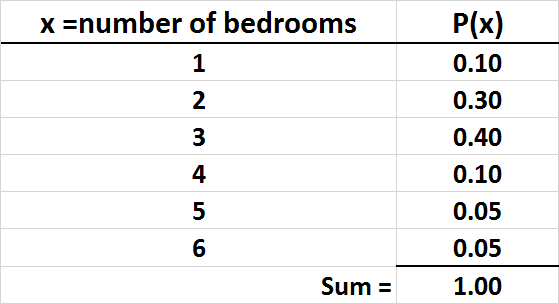
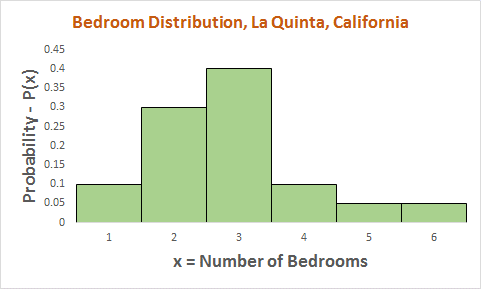
A probability distribution assigns a probability to each possible value of a discrete random variable. The sum of all probabilities must equal 1.
Probability Mass Function (PMF): Function that gives the probability that a discrete random variable is exactly equal to some value.
Example: The probability distribution for the number of bedrooms in homes for sale in La Quinta, California is shown above.
Expected Value (Mean) of a Discrete Probability Distribution
The expected value (mean) of a discrete random variable is the long-run average value of repetitions of the experiment it represents. It is calculated as:
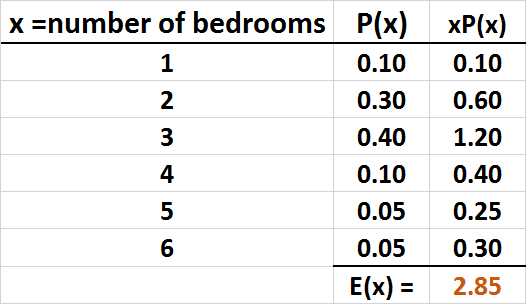
Interpretation: The expected value represents the average outcome if the experiment is repeated many times.
Example: For the bedroom distribution, bedrooms.
Expected Value Example: Dice Game
Suppose you pay $3 to play a game where you roll a die and win $1 times the value shown. The expected profit is calculated as:
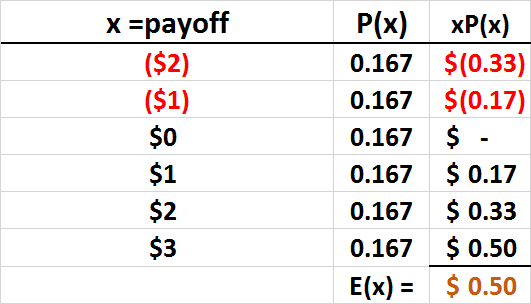
Result: The expected profit per game is $0.50.
Standard Deviation of a Discrete Random Variable
The standard deviation measures the spread or dispersion of the values of a random variable around the mean. It is calculated as:
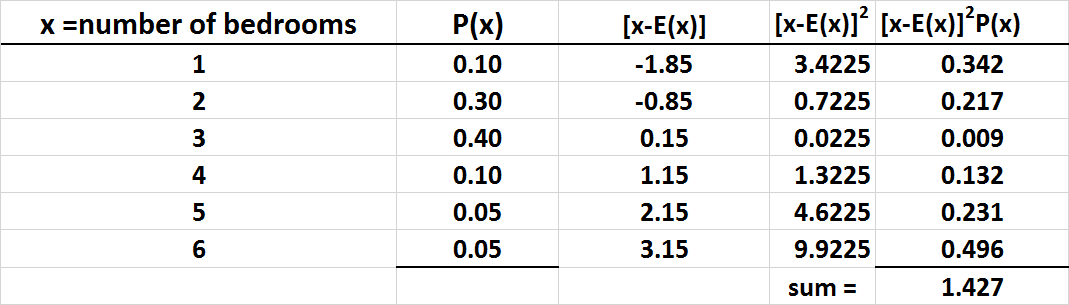
Interpretation: A higher standard deviation indicates greater variability in outcomes.
Standard Deviation Example: Dice Game
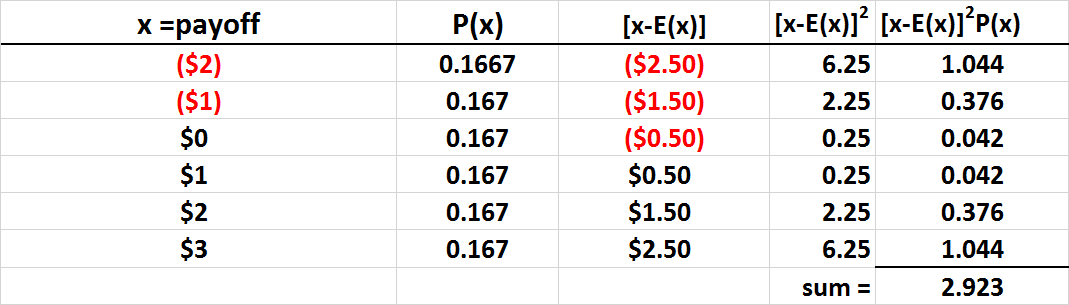
Expected Value and Standard Deviation: Coin Toss Example
Consider tossing two coins. Let be the number of heads. The probability distribution is:
The expected value is .
Expected Value and Standard Deviation: Investment Options
When comparing investment options, expected value and standard deviation help assess both the average return and the risk (variability) associated with each option.
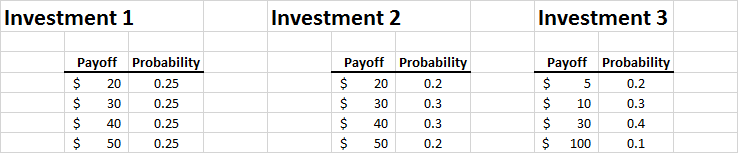



Decision Making: Investors may prefer higher expected value and lower standard deviation, depending on risk tolerance.
The Binomial Probability Distribution
Definition and Properties
The binomial distribution models the probability of obtaining a fixed number of successes in a fixed number of independent trials, each with the same probability of success.
Each trial has two possible outcomes: success or failure.
There are identical trials.
Trials are independent.
The probability of success remains constant.
The probability of failure is .
Examples:
Classifying products as defective or acceptable
Survey responses: yes/no
Job applicants: accept/reject offer
Binomial Probability Formula
The probability of exactly successes in trials is given by:
= number of trials
= number of successes
= probability of success
= probability of failure ()
Binomial Distribution Example: Bank Customer Preferences
A bank surveys 3 customers to see if they prefer Saturday opening. If (prefer Saturday), the probability distribution for customers who prefer Saturday is:
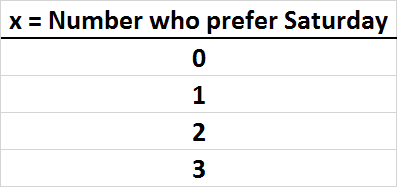
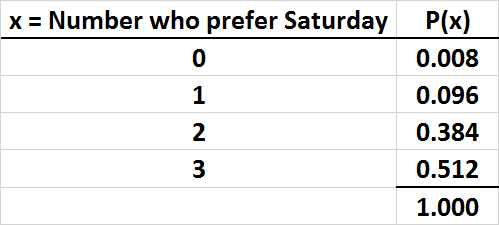
Sample Space: All possible combinations of preferences among 3 customers.
Counting Rule for Combinations
To determine the number of ways successes can occur in trials (order does not matter):
Using the Binomial Formula for Larger Samples
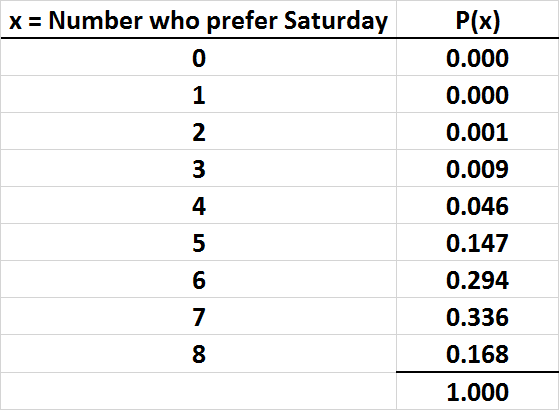
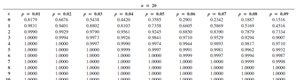
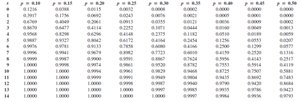
For larger , listing all outcomes is impractical. Use the binomial formula or cumulative binomial tables to find probabilities.
Mean and Standard Deviation of the Binomial Distribution
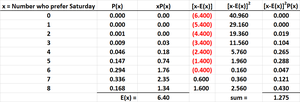
The mean and standard deviation for a binomial distribution are:
Mean:
Standard Deviation:
Applications: Quality Testing
Binomial distributions are used in acceptance sampling plans to decide whether to accept or reject shipments based on the number of defective items found in a sample.
Objective: High probability of accepting good shipments, low probability of accepting bad shipments.
Other Discrete Probability Distributions
The Poisson Distribution
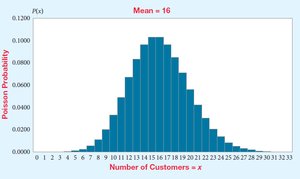
The Poisson distribution describes the probability of a given number of events occurring in a fixed interval of time or space, when these events happen independently and at a constant average rate.
Used when the number of possible outcomes is very large or unknown.
Mean (expected value) per interval is .
Probability of events in interval :
is the base of the natural logarithm (approximately 2.71828).
Poisson Distribution Example
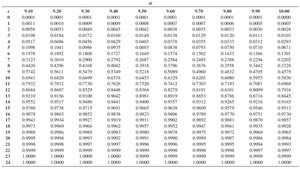
At a baseball park, the average number of customers arriving at a concession stand in 10 minutes is 5. What is the probability that exactly 3 customers arrive in 10 minutes?
Segment size: 10 minutes
Mean
The Hypergeometric Distribution
The hypergeometric distribution applies when sampling is done without replacement from a finite population. It models the probability of successes in draws from a population of size containing successes.
Trials are dependent (probabilities change after each draw).
Used when the binomial distribution is not appropriate due to lack of independence.
Parameters:
= population size
= number of successes in the population
= sample size
= number of successes in the sample
Example: If 3 light bulbs are selected from 10 (4 defective), the probability that 2 are defective is 0.30.
Excel Function: =HYPGEOM.DIST(x, n, X, N, FALSE)
