 Indietro
Hypothesis Testing for a Population Mean: Structured Study Notes
Guida di studio - Note intelligenti
 Appunti personalizzati basati sui tuoi materiali, ampliati con definizioni chiave, esempi e contesto.
Hypothesis Testing for a Population Mean
Introduction to Hypothesis Testing
Hypothesis testing is a fundamental inferential procedure in statistics, used to evaluate assumptions about population parameters based on sample data. It allows analysts to make decisions or inferences about populations using sample statistics.
Definition: Hypothesis testing is the act of testing an assumption regarding a population parameter.
Application: Commonly used in business to assess claims about means, proportions, or other parameters.
Key Terms: Null Hypothesis (H0), Alternative Hypothesis (HA), Significance Level (α), Test Statistic, p-value.
Steps in Hypothesis Testing
The hypothesis testing process is systematic and consists of six main steps:
Step 1: State the null and alternative hypotheses.
Step 2: Select a level of significance (α).
Step 3: Identify the test statistic.
Step 4: Formulate the decision rule.
Step 5: Take a sample and arrive at a decision.
Step 6: Interpret the results.
Step 1: State the Null and Alternative Hypotheses
The hypotheses are statements about the population mean (μ) and must cover all possible values. The null hypothesis always includes equality (e.g., =, ≥, ≤), while the alternative hypothesis is accepted if the sample data provide sufficient evidence against the null.
Null Hypothesis (H0): The statement assumed to be true unless evidence suggests otherwise.
Alternative Hypothesis (HA): The statement accepted if the null is rejected.
Examples:



Step 2: Select a Level of Significance (α)
The significance level (α) is the maximum allowable probability of committing a Type I error (rejecting the null hypothesis when it is true). Common values are 0.05 (95%), 0.01 (99%), and 0.10 (90%).
Type I Error: Rejecting H0 when it is actually true.
Type II Error: Failing to reject H0 when HA is true.
Step 3: Identify the Test Statistic
The test statistic is calculated from sample data and is used to determine whether to reject the null hypothesis. The choice of statistic depends on whether the population standard deviation (σ) is known or unknown.
Z-Statistic: Used when σ is known.
t-Statistic: Used when σ is unknown.
Formula for Z:
Formula for t:
Step 4: Formulate the Decision Rule
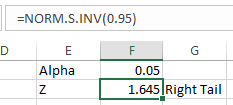
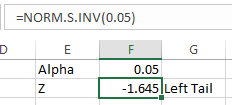
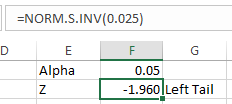
The decision rule specifies the conditions under which the null hypothesis will be rejected. It depends on the significance level, the type of test (one-tailed or two-tailed), and the distribution used.
One-tailed test: Used when the alternative hypothesis is directional (e.g., μ > μ0 or μ < μ0).
Two-tailed test: Used when the alternative hypothesis is non-directional (e.g., μ ≠ μ0).
Critical Value: The threshold value for the test statistic.
Step 5: Take a Sample and Arrive at a Decision
Calculate the test statistic using sample data and compare it to the critical value. If the test statistic falls in the rejection region, reject the null hypothesis; otherwise, fail to reject it.
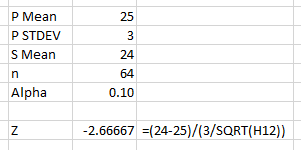
Example Calculation (Z):
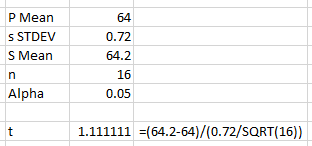
Example Calculation (t):
Step 6: Interpret the Results
Interpret the statistical decision in the context of the original question. Clearly state whether the null hypothesis was rejected or not and what this means for the population parameter.
Example: If the null hypothesis is rejected, conclude that there is sufficient evidence to support the alternative hypothesis.
P-Value Approach
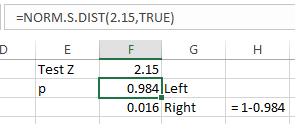
The p-value is the probability of obtaining a test statistic at least as extreme as the one observed, assuming the null hypothesis is true. Compare the p-value to α to make a decision.
If p < α: Reject H0.
If p ≥ α: Fail to reject H0.
Types of Hypothesis Tests
There are three main ways to write hypothesis statements for a population mean:
Null Hypothesis (H0) | Alternative Hypothesis (HA) | Test Type |
|---|---|---|
Two-tailed | ||
One-tailed (left) | ||
One-tailed (right) |
Summary Table: Hypothesis Testing Steps
Step | Description |
|---|---|
1 | State the null and alternative hypotheses |
2 | Select a significance level (α) |
3 | Identify the test statistic (Z or t) |
4 | Formulate the decision rule (critical value) |
5 | Take a sample and calculate the test statistic |
6 | Interpret the results |
Tips for Successful Hypothesis Testing
Always state hypotheses in terms of the population parameter.
Choose the correct test statistic based on available information.
Use the p-value approach for more flexibility in decision-making.
Interpret results in the context of the original business question.
Additional info: These notes expand on the original slides and images by providing full academic context, formulas, and structured explanations suitable for exam preparation in a Statistics for Business course.
