 Indietro
Introduction to Business Statistics: Foundations, Sampling, and Data Classification
Guida di studio - Note intelligenti
 Appunti personalizzati basati sui tuoi materiali, ampliati con definizioni chiave, esempi e contesto.
Introduction to Business Statistics
Definition and Scope
Business statistics is the mathematical science concerned with the collection, analysis, interpretation, and presentation of data to support business decision-making. It transforms raw data into meaningful information using statistical tools and techniques, enabling managers to make informed decisions.
Statistics: The science of collecting, analyzing, and presenting data.
Population: All possible subjects (items or individuals) of interest in a study.
Sample: A subset of the population, selected for analysis.
Variables: Characteristics of items or individuals that can assume different values (e.g., student grade).
Data: The values that variables can assume (e.g., X = 90).
Branches of Statistics
Descriptive Statistics: Summarizes and displays data using graphs, charts, and tables. It describes the main features of a dataset, either from a sample or the entire population.
Inferential Statistics: Makes claims or conclusions about a population based on sample data and probability theory. It involves estimation, prediction, and hypothesis testing.
Examples
Descriptive: "The average exam score for my statistics exam was 88."
Inferential: "A recent poll showed that 75% of Americans had a favorable opinion of the president."
Statistics in Business Applications
Key Areas of Application
Marketing: Estimating population parameters, such as average income of a target group.
Operations: Analyzing associations between qualitative variables (e.g., gender and performance).
Finance and Economics: Examining relationships between quantitative variables (e.g., material price and house price).
Research Project Steps in Business Statistics
Structured Approach
Define the Problem: Clearly state the business problem to be solved.
Define the Population/Sample: Identify the group of interest and select an appropriate sample using sampling methods.
Define the Nature of Data: Determine data collection methods and the level/type of data.
Use Statistical Tools: Apply descriptive and inferential statistical tools to process data and generate information.
Create Knowledge/Make Decisions: Use the information to solve the problem or make business decisions.
Sampling Methods
Probability Sampling
Simple Random Sampling: Every member of the population has an equal chance of being selected.
Systematic Sampling: Every kth member is chosen, where (N = population size, n = sample size).
Stratified Sampling: The population is divided into mutually exclusive groups (strata), and a random sample is taken from each stratum. This ensures all groups are represented, increasing accuracy.
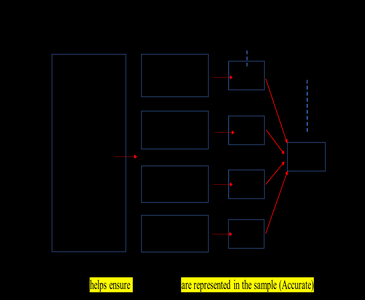
Cluster Sampling: The population is divided into clusters (often geographically), and entire clusters are randomly selected for the sample. This method is economical and practical for large populations.
Resampling: Involves repeatedly drawing samples from a population, often using computer software (e.g., bootstrap method) to estimate parameters.
Nonprobability Sampling
Convenience Sampling: Samples are selected based on ease of access. While quick and easy, this method may not be representative of the population.
Data Classification
Types of Data
Qualitative Data (Categorical): Non-numerical, classified by attributes or characteristics (e.g., gender, type of car).
Quantitative Data (Numerical): Numerical values, further divided into:
Discrete Variables: Countable values (e.g., number of students).
Continuous Variables: Measurable values, can take any value within a range (e.g., temperature).
Levels of Measurement
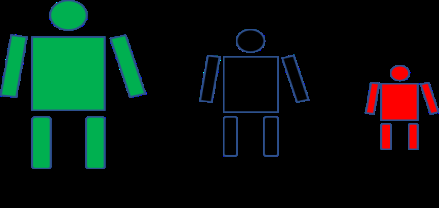
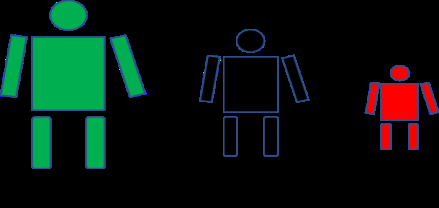
Nominal: Categories with no inherent order (e.g., types of cars).
Ordinal: Categories with a ranked order, but differences between ranks are not meaningful (e.g., letter grades).
Interval: Ordered categories with meaningful differences, but no true zero (e.g., IQ scores, temperature in Celsius).
Ratio: Like interval, but with a true zero point (e.g., price, number of items).

Data Collection Methods
Primary vs. Secondary Data
Primary Data: Collected directly by the researcher for a specific purpose (e.g., surveys, experiments, direct observation, interviews, focus groups).
Secondary Data: Collected by someone else and made available for use (e.g., government statistics, published reports).
Primary Data Collection Techniques
Direct Observation: Observing subjects in their natural environment.
Focus Group: Guided group discussions to gather opinions or attitudes.
Experiment: Manipulating variables to observe effects.
Survey: Asking questions directly to respondents.
Interview: Structured or unstructured questioning of individuals.
Ethics in Statistics
Common Ethical Issues
Biased Sample: A sample that does not represent the intended population, leading to distorted findings.
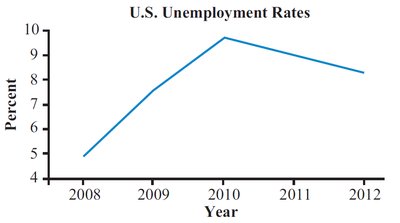
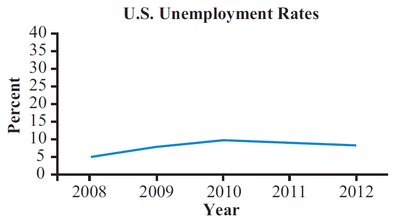
Misleading Graphs: Changing the scale or visual representation of data to exaggerate or minimize trends.
Graph with Standard Scale | Graph with Altered Scale |
|---|---|
|
|
Summary Table: Sampling Methods
Sampling Method | Description | Example |
|---|---|---|
Simple Random | Every member has equal chance of selection | Randomly select 20 employees using software |
Systematic | Select every k-th member | Every 3rd house on a street |
Stratified | Divide into strata, sample from each | Sample students by class standing |
Cluster | Divide into clusters, sample entire clusters | Sample all homes on randomly chosen streets |
Convenience | Sample those easiest to access | First 20 homes passed in a neighborhood |
Summary Table: Data Types and Levels of Measurement
Data Source | Type | Level of Measurement |
|---|---|---|
Your IQ scores | Quantitative | Interval |
Price for one gallon of gasoline | Quantitative | Ratio |
Letter grade in statistics | Qualitative | Ordinal |
Number of boxes of cereal | Quantitative | Ratio |
Types of cars | Qualitative | Nominal |
Conclusion
Understanding the foundations of business statistics—including the distinction between descriptive and inferential statistics, sampling methods, data classification, and ethical considerations—is essential for effective data-driven decision-making in business contexts.
