 Indietro
Sampling Distributions and Estimation in Business Statistics
Guida di studio - Note intelligenti
 Appunti personalizzati basati sui tuoi materiali, ampliati con definizioni chiave, esempi e contesto.
Sampling Distributions
Definition and Importance
Sampling distributions are fundamental in inferential statistics, describing the probability distribution of a given statistic based on a random sample. They allow us to make probabilistic statements about population parameters using sample data.
Sampling Distribution: The probability distribution of a statistic (such as the mean or proportion) calculated from all possible samples of a specific size drawn from a population.
Sample Statistic: A random variable whose value depends on the items in the random sample. It may or may not represent the population well, depending on sample size.
Example: If X is uniformly distributed between 18 and 24, then .
Standard Deviation of Sample Mean: for the given example.
Sampling Distribution Properties
As sample size (n) increases, the standard deviation of the sample mean decreases, making the sample mean a more precise estimator of the population mean.
If the population is normal, the sampling distribution of the mean is also normal with the same mean and a smaller standard deviation.
Central Limit Theorem (CLT)
Statement and Implications
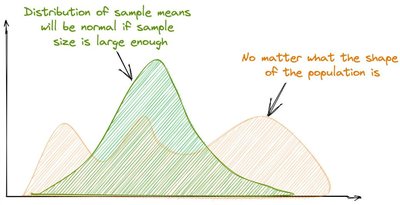
The Central Limit Theorem (CLT) is a cornerstone of statistics, stating that the sampling distribution of the sample mean approaches a normal distribution as the sample size increases, regardless of the population's shape.
CLT: For large enough sample sizes (typically n > 30), the distribution of sample means will be approximately normal, even if the population distribution is not normal.
Application: This allows for the use of normal probability models in inference, even with non-normal populations.
Chi-Square Distribution
Definition and Properties
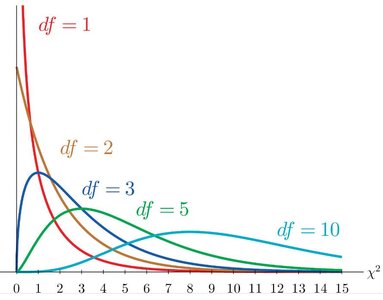
The chi-square (χ²) distribution is used in hypothesis testing, especially for categorical data and variance estimation.
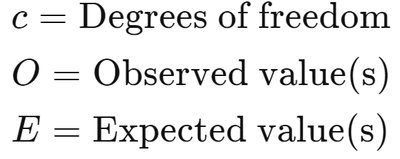
Degrees of Freedom (df): The number of independent values in a calculation, typically n - 1 for a sample of size n.
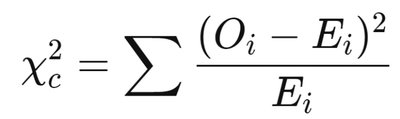
Chi-Square Statistic: , where O = observed values, E = expected values.
Applications: Goodness-of-Fit and Independence
Goodness-of-Fit Test: Determines if observed categorical data fit an expected distribution (e.g., M&M color distribution).
Test of Independence: Assesses whether two categorical variables are independent (e.g., gender and political party preference).
Student's t-Distribution
Definition and Use
The t-distribution is used when estimating population parameters when the sample size is small and/or the population standard deviation is unknown.
Properties: Bell-shaped and symmetric, but with heavier tails than the normal distribution. As sample size increases, the t-distribution approaches the normal distribution.
Degrees of Freedom: df = n - 1, where n is the sample size.
Estimation and Confidence Intervals
Point and Interval Estimation
Estimation involves inferring population parameters from sample statistics. There are two main types:
Point Estimation: Provides a single value as an estimate of a population parameter.
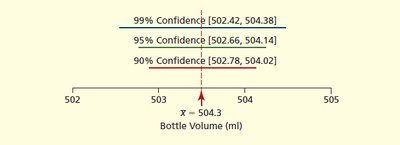
Interval Estimation (Confidence Interval): Provides a range of values within which the parameter is expected to lie, with a certain level of confidence.
Confidence Interval for the Mean (σ Known)
Formula:
Common confidence levels: 90%, 95%, 99% (corresponding Z-values: 1.645, 1.96, 2.58)
Confidence Interval for the Mean (σ Unknown)
Formula:
Use the t-distribution when the population standard deviation is unknown.
Confidence Interval for a Proportion
Formula:
Used to estimate the proportion of a population with a certain characteristic.
Determining Sample Size
Sample Size for Mean
Formula:
Where e is the desired margin of error.
Sample Size for Proportion
Formula:
Where π is the estimated proportion and e is the margin of error.
Statistical Pitfalls and Critical Thinking
Common Logical Pitfalls
Drawing conclusions from small or nonrandom samples.
Confusing correlation with causation.
Generalizing from group data to individuals.
Ignoring unconscious bias and the difference between statistical significance and practical importance.
Statistics supports critical thinking by providing tools to test ideas against empirical evidence, but careful attention must be paid to study design and interpretation.
