Indietro
Step-by-Step Guidance for Hypothesis Testing (Z-Test for Mean)
Guida di studio - Note intelligenti
 Appunti personalizzati basati sui tuoi materiali, ampliati con definizioni chiave, esempi e contesto.
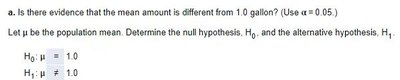
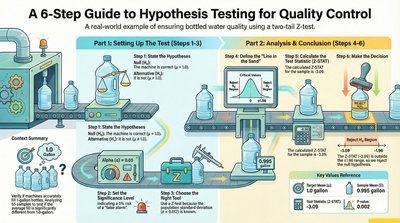
Q1. Is there evidence that the mean amount of water is different from 1.0 gallon? (Use α = 0.05.)
Background
Topic: Hypothesis Testing for the Mean (Z-Test, Population Standard Deviation Known)
This question tests your understanding of how to conduct a hypothesis test for a population mean when the population standard deviation is known. You are asked to determine if the mean amount of water in 1-gallon bottles differs from the target value of 1.0 gallon.

Key Terms and Formulas
Null Hypothesis (H0): The population mean is equal to the target value.
Alternative Hypothesis (H1): The population mean is not equal to the target value.
Z-Test Statistic Formula:
= sample mean
= hypothesized population mean
= population standard deviation
= sample size
Step-by-Step Guidance
State the null and alternative hypotheses:
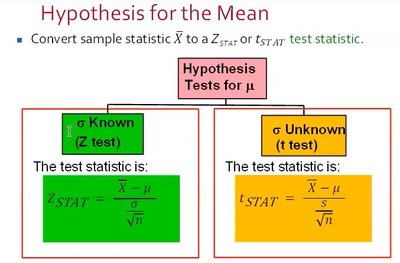
Identify the known values:
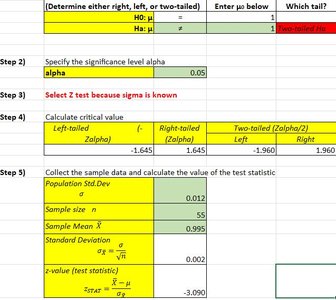
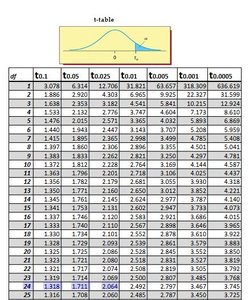
Determine the critical values for a two-tailed test at :
For a two-tailed test, the critical z-values are .
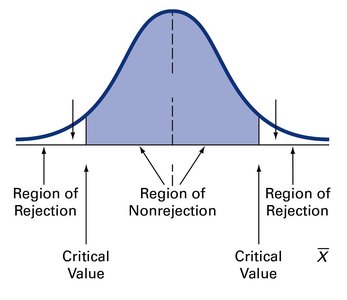
Calculate the test statistic using the formula:
Compute the denominator first:
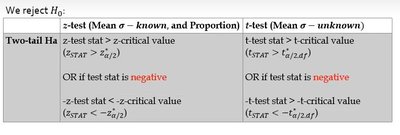
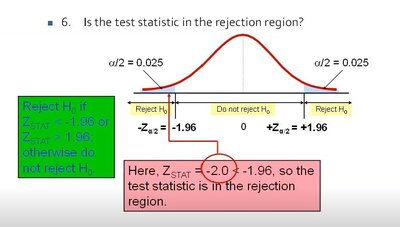
Compare the calculated to the critical values ( and ) to determine if it falls in the rejection region.
Try solving on your own before revealing the answer!
Final Answer:
The calculated is approximately , which is less than . Therefore, the test statistic falls in the rejection region.
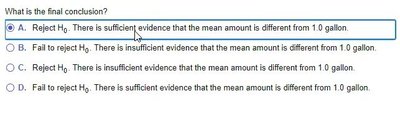
Conclusion: Reject . There is sufficient evidence that the mean amount is different from 1.0 gallon.
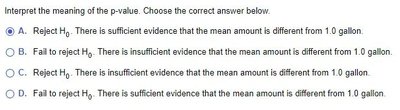
Q2. Interpret the meaning of the p-value for this test.
Background
Topic: p-Value Approach to Hypothesis Testing
This question tests your understanding of how to interpret the p-value in the context of hypothesis testing. The p-value represents the probability of obtaining a test statistic as extreme as the observed one, assuming the null hypothesis is true.
Key Terms and Formulas
p-value: The probability of observing a test statistic as extreme as the one calculated, given that is true.
Decision Rule:
If p-value , reject . If p-value , do not reject $H_0$.
Step-by-Step Guidance
Calculate the p-value for the test statistic found in Q1.
For a two-tailed test, double the probability in one tail.
Compare the p-value to the significance level .
If the p-value is less than , you reject the null hypothesis.
Try solving on your own before revealing the answer!
Final Answer:
The p-value is approximately . Since , you reject .
Interpretation: There is sufficient evidence that the mean amount is different from 1.0 gallon.
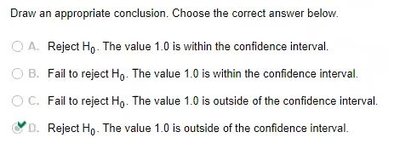
Q3. Draw an appropriate conclusion based on the confidence interval.
Background
Topic: Confidence Intervals and Hypothesis Testing
This question tests your ability to use a confidence interval to make a decision about the null hypothesis. If the hypothesized mean is outside the confidence interval, you reject .
Key Terms and Formulas
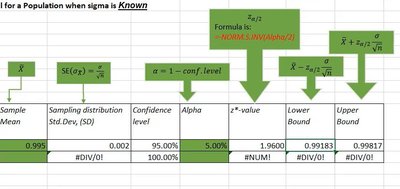
Confidence Interval Formula (for mean, known):
= critical value for desired confidence level
Step-by-Step Guidance
Calculate the confidence interval using the sample mean, standard deviation, and sample size.
Check if the hypothesized mean (1.0 gallon) is inside or outside the interval.
If the value is outside the interval, you reject .
Try solving on your own before revealing the answer!
Final Answer:
The value 1.0 is outside the confidence interval, so you reject .
Conclusion: The results from the confidence interval agree with the hypothesis test.
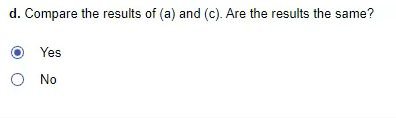
Q4. Compare the results of (a) and (c). Are the results the same?
Background
Topic: Consistency of Hypothesis Test and Confidence Interval
This question checks your understanding of whether the hypothesis test and confidence interval lead to the same conclusion.
Key Terms and Formulas
Consistency: Both methods should agree if the confidence level matches the significance level.
Step-by-Step Guidance
Review the conclusions from parts (a) and (c).
Check if both methods led to rejecting .
Try solving on your own before revealing the answer!
Final Answer:
Yes, the results are the same. Both the hypothesis test and the confidence interval lead to rejecting .
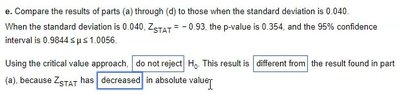
Q5. Compare the results of parts (a) through (d) to those when the standard deviation is 0.040.
Background
Topic: Effect of Standard Deviation on Hypothesis Testing
This question tests your understanding of how changing the standard deviation affects the test statistic, p-value, and confidence interval.
Key Terms and Formulas
Test Statistic:
p-value: Probability associated with the test statistic
Confidence Interval:
Step-by-Step Guidance
Calculate the new test statistic using .
Find the new p-value and confidence interval.
Compare the new results to the previous ones.
Discuss how the larger standard deviation affects the outcome.
Try solving on your own before revealing the answer!
Final Answer:
With , the test statistic decreases in absolute value, the p-value increases, and the confidence interval widens. The result is different from part (a): you do not reject because the evidence is weaker.