 Indietro
Calc 9: Arc Length, Curvature, and Functions of Several Variables
Guida di studio - Note intelligenti
 Appunti personalizzati basati sui tuoi materiali, ampliati con definizioni chiave, esempi e contesto.
Arc Length and Curvature of Vector Functions
Arc Length for Vector Functions
The arc length of a curve described by a vector function provides a measure of the distance along the curve between two points. For a parameterized curve \( \mathbf{r}(t) = \langle f(t), g(t), h(t) \rangle \), where \( f', g', h' \) are continuous and \( t \) ranges from \( a \) to \( b \), the arc length \( L \) is given by:
\( L = \int_a^b \sqrt{f'(t)^2 + g'(t)^2 + h'(t)^2} \, dt = \int_a^b |\mathbf{r}'(t)| \, dt \)
This formula generalizes the arc length calculation from single-variable calculus to curves in higher dimensions.
Curvature
Curvature measures how sharply a curve bends at a given point. For a smooth parameterized curve \( \mathbf{r}(t) \):
Let \( \mathbf{v} = \mathbf{r}'(t) \) (velocity) and \( \mathbf{T} \) (unit tangent vector).
The curvature \( \kappa(t) \) is given by:
Alternatively, using velocity \( \mathbf{v} \) and acceleration \( \mathbf{a} = \mathbf{v}' \):
Example: For \( \mathbf{r}(t) = (3\cos t, 3\sin t, 4t) \), the curvature is \( \kappa(t) = \frac{3}{25} \).
Functions of Several Variables
Definition: Function, Domain, and Range with Two Independent Variables
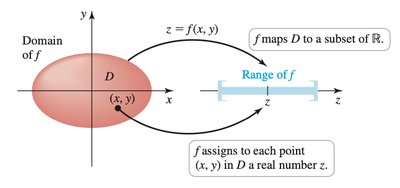
A function of two variables \( z = f(x, y) \) assigns a unique real number \( z \) to each point \( (x, y) \) in a set \( D \subset \mathbb{R}^2 \). The set \( D \) is called the domain of \( f \), and the set of all possible output values \( z \) is the range of \( f \).
Examples:
\( f(x, y) = x + y \)
\( f(x, y) = \arctan(x^7 + e^{\sin y} + 4) \)
\( f(x, y) = x^2 + y^2 \)
Domains for two-variable functions can be more complex than for single-variable functions, often forming regions or shapes in the plane.
Determining Domains
Example: For \( f(x, y) = \ln(x + y) \), the domain is all \( (x, y) \) such that \( x + y > 0 \), which is a half-plane above the line \( y = -x \).
Example: For \( f(x, y) = \sqrt{x^2 + y^2 - 1} \), the domain is all \( (x, y) \) such that \( x^2 + y^2 \geq 1 \), i.e., on and outside a circle of radius 1 centered at the origin.
Graphs of Functions of Two Variables
Graphs help visualize functions of two variables by representing the set of points \( (x, y, z) \) where \( z = f(x, y) \). This allows us to see features such as maxima, minima, and saddle points.
Example: The graph of \( f(x, y) = \sqrt{x^2 + y^2 - 1} \) is the top half of a hyperboloid of one sheet, since \( z^2 = x^2 + y^2 - 1 \) and only positive \( z \) values are allowed.
Example: The graph of \( f(x, y) = \sqrt{x^2 + y^2} \) is the top half of a cone, since \( z^2 = x^2 + y^2 \) and \( z \geq 0 \).
Level Curves
Level curves of a function \( f(x, y) \) are the sets of points where the function takes a constant value, i.e., \( f(x, y) = c \). These curves are useful for visualizing the behavior of functions, similar to contour lines on a topographical map.
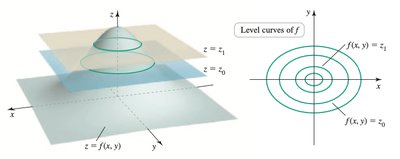
Example: For \( f(x, y) = \sqrt{y - x^2} \), the level curves are parabolas given by \( y = x^2 + c^2 \) for \( c \geq 0 \).
Example: For \( f(x, y) = 5 + e^{2x - 3y} \), the level curves are lines of the form \( 2x - 3y = \ln(c - 5) \).
Level Surfaces
For functions of three variables \( F(x, y, z) \), level surfaces are the sets of points where \( F(x, y, z) = c \). For example, the level surfaces of \( F(x, y, z) = x^2 + y^2 + z^2 \) are spheres centered at the origin.
Functions of n Variables
A function of n variables \( x_{n+1} = f(x_1, x_2, \ldots, x_n) \) assigns a unique real number to each point in a domain \( D \subset \mathbb{R}^n \). In this course, focus is on functions of two and three variables.
