 Indietro
Limits and Vertical Asymptotes from a Graph
Guida di studio - Note intelligenti
 Appunti personalizzati basati sui tuoi materiali, ampliati con definizioni chiave, esempi e contesto.
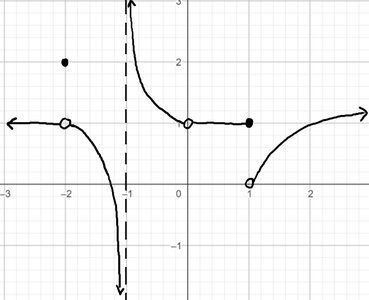
Q4. For the function h whose graph is shown, state the following:
(a)
(b)
(c)
(d)
(e)
(f)
(g)
(h)
(i) The equations of the vertical asymptotes.
Background
Topic: Limits and Vertical Asymptotes from a Graph
This question tests your ability to interpret one-sided and two-sided limits, as well as identify vertical asymptotes, using a graph of a function. You need to analyze the behavior of the function as approaches specific values from the left and right, and determine where the function becomes unbounded (vertical asymptotes).
Key Terms and Formulas:
Limit: is the value approaches as gets close to .
One-sided limit: (from the left), (from the right).
Vertical asymptote: A line where increases or decreases without bound as approaches .
Step-by-Step Guidance
Examine the graph at each specified -value. For one-sided limits, observe the behavior of as $x$ approaches the value from the left or right.
For (a) and (b), look at . Check how the function behaves as approaches from both sides. Is there a jump, hole, or does the function approach a specific value?
For (c) and (d), focus on . Notice if the function approaches infinity or negative infinity, or if it settles at a finite value. Is there a vertical dashed line indicating a vertical asymptote?
For (e) and (f), analyze . Is there a hole, jump, or does the function continue smoothly?
For (g) and (h), look at . Check for open or closed circles, jumps, or smooth behavior.
For (i), identify any vertical dashed lines or places where the function goes to infinity, which indicate vertical asymptotes. Write the equation(s) for these lines.
For each limit, compare the left and right behavior. If the left and right limits are not equal, the two-sided limit does not exist at that point.
Stop here and try to determine the values or behaviors for each part using the graph.
Try solving on your own before revealing the answer!
Final Answers:
(a) The function approaches the value at the open circle on the left of .
(b) The function approaches the value at the open circle on the right of .
(c) (the function decreases without bound as approaches from the left).
(d) (the function increases without bound as approaches from the right).
(e) The function approaches the value at the open circle on the left of .
(f) The function approaches the value at the open circle on the right of .
(g) The function approaches the value at the open circle on the left of .
(h) The function approaches the value at the open circle on the right of .
(i) The equation of the vertical asymptote is (where the function goes to ).
The graph shows open and closed circles, jumps, and a vertical dashed line at , indicating a vertical asymptote. The limits at $x = -1$ are infinite, and the other limits depend on the values at the open circles.
