

Ch. 3 - Derivatives
Briggs - Calculus: Early Transcendentals 3rd Edition
Briggs3rd EditionCalculus: Early TranscendentalsISBN: 9780136847243Non è quello che usi tu?Cambia libro di testo
Capitolo 3, Problema 3.10.62a

62–65. {Use of Tech} Graphing f and f'
a. Graph f with a graphing utility.
f(x) = (x−1) sin^−1 x on [−1,1]

Guida verificata passo dopo passo
1
Step 1: Understand the function f(x) = (x - 1) sin^−1(x). This function is composed of two parts: a linear term (x - 1) and the inverse sine function sin^−1(x). The domain of sin^−1(x) is [-1, 1], which matches the interval given for graphing.
Step 2: Use a graphing utility to plot the function f(x) over the interval [-1, 1]. Ensure that the graphing tool can handle inverse trigonometric functions and is set to the correct interval.
Step 3: Analyze the graph of f(x). Look for key features such as intercepts, maxima, minima, and points of inflection. Note how the linear term (x - 1) affects the shape of the graph in combination with sin^−1(x).
Step 4: To graph f'(x), first find the derivative of f(x). Use the product rule for differentiation, which states that if you have a function h(x) = u(x)v(x), then h'(x) = u'(x)v(x) + u(x)v'(x). Apply this to f(x) = (x - 1) sin^−1(x).
Step 5: After finding f'(x), use the graphing utility to plot the derivative over the same interval [-1, 1]. Compare the graphs of f(x) and f'(x) to understand how the derivative reflects the rate of change and behavior of the original function.

Risposta video verificata per un problema simile:

Questa soluzione video è stata consigliata dai nostri tutor come utile per risolvere questo problema.
Durata del video:
4m

Concetti chiave

Ecco i concetti essenziali che devi comprendere per rispondere correttamente alla domanda.

Graphing Functions

Graphing functions involves plotting points on a coordinate system to visualize the behavior of the function. For the function f(x) = (x−1) sin^−1 x, understanding its domain and range is crucial, especially since it is defined on the interval [-1, 1]. A graphing utility can help illustrate key features such as intercepts, maxima, minima, and asymptotic behavior.
Video consigliato:
Percorso guidato
5:53
Graph of Sine and Cosine Function

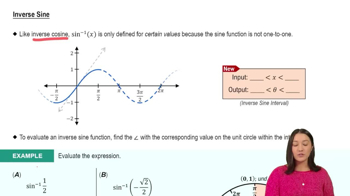
Inverse Sine Function

The inverse sine function, denoted as sin^−1 x or arcsin x, is the function that returns the angle whose sine is x. Its range is limited to [-π/2, π/2], which is important when analyzing the function f(x) = (x−1) sin^−1 x. Understanding how this function behaves within its domain helps in predicting the overall shape of f.
Video consigliato:
4:03
Inverse Sine

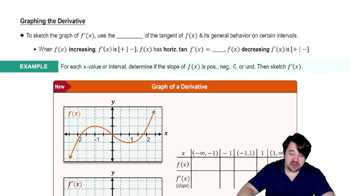
Derivative and Its Graph

The derivative of a function, denoted as f', represents the rate of change of the function with respect to its variable. Graphing f' provides insights into the function's increasing or decreasing behavior, as well as its critical points. For f(x) = (x−1) sin^−1 x, calculating f' will reveal where the function has local maxima or minima, which is essential for a complete analysis.
Video consigliato:
Percorso guidato
06:15
Graphing The Derivative
Pratica correlata
Domanda del libro di testo

Comparing velocities Two stones are thrown vertically upward, each with an initial velocity of 48 ft/s at time t=0. One stone is thrown from the edge of a bridge that is 32 feet above the ground, and the other stone is thrown from ground level. The height above the ground of the stone thrown from the bridge after t seconds is f(t) = − 16t²+48t+32. and the height of the stone thrown from the ground after t seconds is g(t) = −16t²+48t.

a. Show that the stones reach their high points at the same time.

304
views
Domanda del libro di testo

31–32. Velocity functions A projectile is fired vertically upward into the air, and its position (in feet) above the ground after t seconds is given by the function s(t).

a. For the following functions s(t), find the instantaneous velocity function v(t). (Recall that the velocity function v is the derivative of the position function s.)

s(t)= −16t²+100t

245
views
Domanda del libro di testo

Use definition (2) (p. 135) to find the slope of the line tangent to the graph of f at P.

f(x) = -7x; P(-1,7)

201
views
Domanda del libro di testo

Use definition (2) (p. 135) to find the slope of the line tangent to the graph of f at P.

f(x) = 1/x; P (1,1)

201
views
Domanda del libro di testo

Vertical tangent lines If a function f is continuous at a and lim x→a| f′(x)|=∞, then the curve y=f(x) has a vertical tangent line at a, and the equation of the tangent line is x=a. If a is an endpoint of a domain, then the appropriate one-sided derivative (Exercises 71–72) is used. Use this information to answer the following questions.

73. {Use of Tech} Graph the following functions and determine the location of the vertical tangent lines.

a. f(x) = (x-2)^1/3

353
views
Domanda del libro di testo

13-26 Implicit differentiation Carry out the following steps.

a. Use implicit differentiation to find dy/dx.

tan xy = x+y; (0,0)

222
views