Indietro
Basics of Functions and Their Graphs
Guida di studio - Note intelligenti
 Appunti personalizzati basati sui tuoi materiali, ampliati con definizioni chiave, esempi e contesto.
Functions and Their Graphs
Relations
A relation is any set of ordered pairs. The set of all first components (x-values) is called the domain, and the set of all second components (y-values) is called the range.
Domain: The set of all possible input values (x-values).
Range: The set of all possible output values (y-values).
Example: For the relation {(0, 9.1), (10, 6.7), (20, 10.7), (30, 13.2), (40, 21.2)}, the domain is {0, 10, 20, 30, 40} and the range is {9.1, 6.7, 10.7, 13.2, 21.2}.
Functions
A function is a special type of relation in which each element in the domain corresponds to exactly one element in the range.
If any x-value is paired with more than one y-value, the relation is not a function.
Example: The relation {(1, 2), (3, 4), (6, 5), (8, 5)} is a function because each x-value is paired with only one y-value.
Functions as Equations
Functions can also be defined by equations. An equation defines y as a function of x if, for every x in the domain, there is exactly one corresponding y-value.
If an equation is solved for y and more than one value of y can be obtained for a given x, then the equation does not define y as a function of x.
Example: The equation does not define y as a function of x because, for some x-values, there are two possible y-values.
Function Notation
The special notation f(x), read as "f of x" or "f at x", represents the value of the function at the number x.
Example: If , then means substitute -5 for x in the formula.
Graphing Functions
Functions can be represented graphically in the rectangular coordinate system. The graph of a function is the set of all points (x, f(x)).
Example: Graph the functions and on the same axes.
Vertical Line Test
The vertical line test is a graphical method to determine if a graph represents a function. If any vertical line intersects the graph at more than one point, the graph does not represent a function.
Application: Use the vertical line test to identify graphs in which y is a function of x.
Evaluating Functions from Graphs
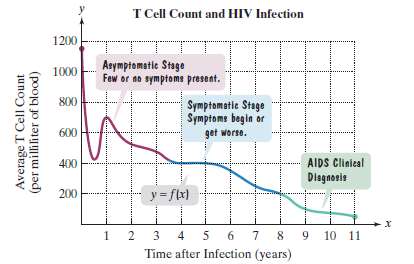
To evaluate a function at a specific value using its graph, locate the x-value on the x-axis and find the corresponding y-value on the graph.
Example: Use the graph to find f(5). For what value of x is f(x) = 100?
Domain and Range from Graphs
To find the domain of a function from its graph, look for all the inputs on the x-axis that correspond to points on the graph. To find the range, look for all the outputs on the y-axis that correspond to points on the graph.
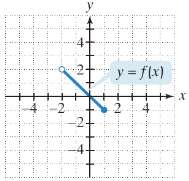
Example: Use the graph of the function to identify its domain and its range.
x-Intercepts and y-Intercepts
The x-intercept(s) of a function are the points where the graph crosses the x-axis (where y = 0). The y-intercept is the point where the graph crosses the y-axis (where x = 0). A function can have more than one x-intercept but at most one y-intercept.
To find the x-intercept(s): Look for the points at which the graph crosses the x-axis.
To find the y-intercept: Look for the point at which the graph crosses the y-axis.
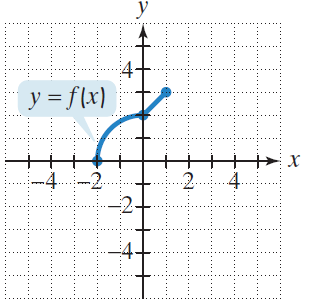
Example: Identify the x- and y-intercepts for the graph of f(x).