Indietro
College Algebra Chapter 2: Functions and Their Graphs
Guida di studio - Note intelligenti
 Appunti personalizzati basati sui tuoi materiali, ampliati con definizioni chiave, esempi e contesto.
Functions and Their Graphs
Basics of Functions
A function is a relation in which each element of the domain corresponds to exactly one element of the range. The domain is the set of all possible input values (usually x-values), and the range is the set of all possible output values (usually y-values).
Independent variable: The variable (usually x) that can be assigned any value from the domain.
Dependent variable: The variable (usually y) whose value depends on the independent variable.
Function notation: The notation f(x) represents the value of the function at x.
Example: Determine if the relation {(10,4), (−2,4), (−1,1), (−2,6)} is a function. Since −2 appears twice with different outputs, this is not a function.
Functions as Equations
To determine if an equation represents a function, solve for y and check if each x-value yields only one y-value.
Vertical Line Test: If any vertical line intersects a graph in more than one point, the graph does not represent a function.
Identifying Domain and Range from Graphs
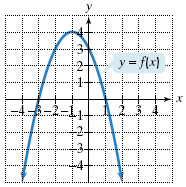
The domain and range can be identified from the graph of a function by observing the extent of the graph along the x-axis (domain) and y-axis (range).
Intercepts of Functions
The x-intercepts (also called zeros) are the x-values for which y = 0. The y-intercept is the y-value when x = 0.
More on Functions and Their Graphs
Difference Quotient
The difference quotient is a fundamental concept in calculus and is used to find the average rate of change of a function:
Formula:
Increasing, Decreasing, and Constant Functions
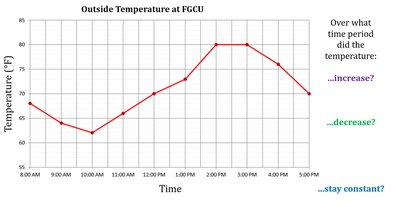
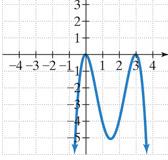
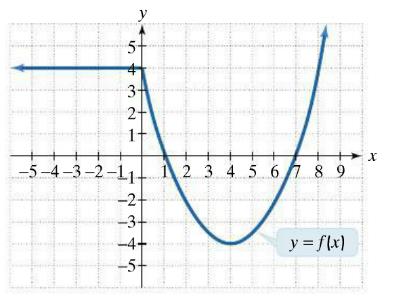
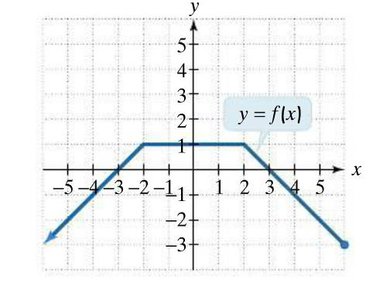
A function is increasing on an interval if its y-values rise as x increases, decreasing if y-values fall, and constant if y-values remain unchanged.
Relative Maxima and Minima
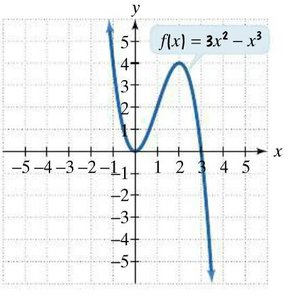
Relative maxima and minima are points where the function changes from increasing to decreasing (maximum) or decreasing to increasing (minimum).
Even and Odd Functions and Symmetry
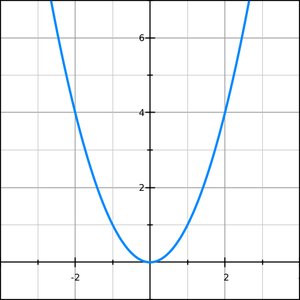
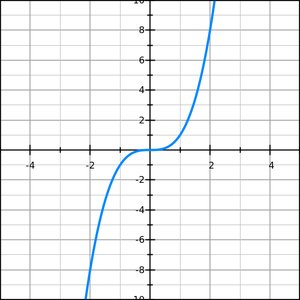
An even function satisfies and is symmetric about the y-axis. An odd function satisfies and is symmetric about the origin.
Piecewise Functions
Definition and Evaluation
A piecewise function is defined by different expressions for different intervals of the domain.
Example:
Linear Functions and Slope
Forms of Linear Equations
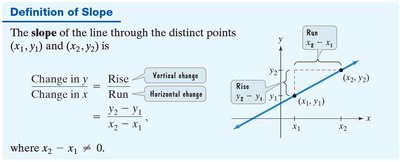
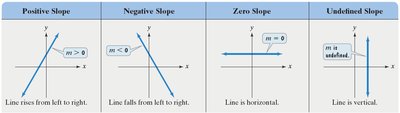
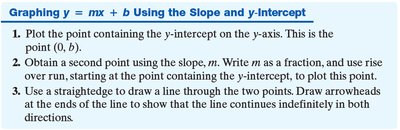
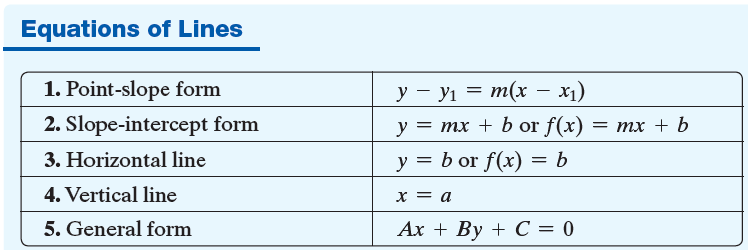
There are several standard forms for the equation of a line:
Point-slope form:
Slope-intercept form:
General form:
Using Intercepts to Graph
To graph , find the x-intercept (set y = 0) and y-intercept (set x = 0), then plot these points.
More on Slope
Parallel and Perpendicular Lines
Parallel lines: Have equal slopes.
Perpendicular lines: The slope of one is the negative reciprocal of the other.
Average Rate of Change
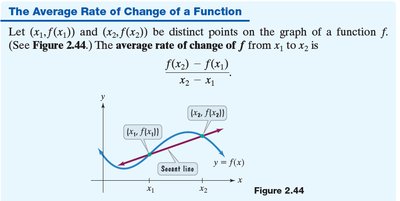
The average rate of change of a function between two points and is:
Formula:
Transformations of Functions
Types of Transformations
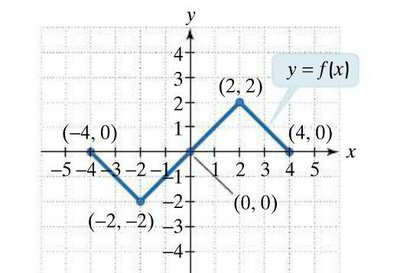
Transformations include shifting, reflecting, stretching, and compressing the graph of a function.
Vertical shift:
Horizontal shift:
Reflection: or
Stretch/Compression:
Combinations and Composite Functions
Algebraic Operations on Functions
Functions can be added, subtracted, multiplied, and divided. The domain of the resulting function is the intersection of the domains of the original functions, except for division where the denominator cannot be zero.
Composite Functions
The composition of functions and is . The domain is all x such that x is in the domain of g and g(x) is in the domain of f.
Decomposing Functions
Decomposition is expressing a function as a composition of two or more simpler functions.
Inverse Functions
Definition and Properties
The inverse of a function f is denoted . A function has an inverse if it is one-to-one (passes the horizontal line test).
Steps to find the inverse:
Replace with .
Switch x and y.
Solve for y.
Replace y with .
Check: and .
Distance and Midpoint Formulas; Circles
Distance Formula
The distance between two points and is:
Formula:
Midpoint Formula
The midpoint of a segment with endpoints and is:
Formula:
Circles
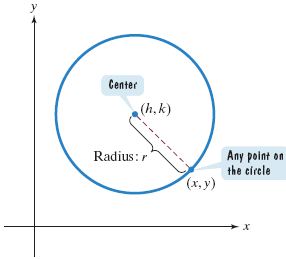
A circle is the set of all points equidistant from a fixed point (center). The general form of the equation of a circle is . The standard form is , where (h, k) is the center and r is the radius.