 Indietro
College Algebra Exam 1 Study Guide: Step-by-Step Guidance
Guida di studio - Note intelligenti
 Appunti personalizzati basati sui tuoi materiali, ampliati con definizioni chiave, esempi e contesto.
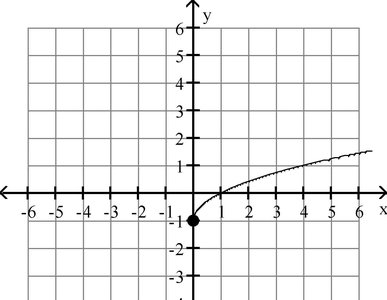
Q16. Use the graph to determine the function's domain and range.
Background
Topic: Domain and Range of Functions
This question tests your ability to interpret a graph and identify the domain (all possible x-values) and range (all possible y-values) of a function.
Key Terms:
Domain: The set of all input values (x-values) for which the function is defined.
Range: The set of all output values (y-values) that the function can produce.
Step-by-Step Guidance
Examine the graph to see where the function starts and ends along the x-axis. Look for any restrictions, such as open circles or breaks, that indicate where the function is not defined.
Identify the lowest x-value where the function begins. In this graph, the function starts at (notice the filled circle at ), and continues to the right.
Determine if the function extends infinitely to the right. If so, the domain will include all .
Next, look at the y-values the function attains. Find the lowest y-value and see if the function increases without bound.
Check for any gaps or jumps in the y-values. Does the function ever dip below ? Does it reach all values above ?
Try solving on your own before revealing the answer!
Final Answer:
Domain: Range:
The function starts at and continues to the right, so the domain is . The lowest y-value is (at ), and the function increases without bound, so the range is .
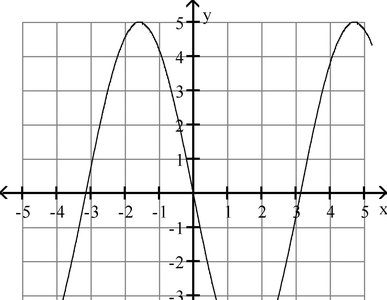
Q20. Use the graph of the given function to find any relative maxima and relative minima.
Background
Topic: Relative Maxima and Minima
This question tests your ability to analyze a graph and identify points where the function reaches a local maximum or minimum value.
Key Terms:
Relative Maximum: A point where the function value is higher than at any nearby points.
Relative Minimum: A point where the function value is lower than at any nearby points.
Step-by-Step Guidance
Look for peaks (highest points in a neighborhood) and valleys (lowest points in a neighborhood) on the graph.
Identify the x-values where these peaks and valleys occur. For this cubic function, you should see one maximum and one minimum.
Estimate the coordinates of these points by reading from the graph. Pay attention to the grid lines for accuracy.
Check if the function has any other local extrema within the visible range.
Try solving on your own before revealing the answer!
Final Answer:
Relative minimum: Relative maximum:
The graph shows a local maximum at and a local minimum at .
