 Indietro
College Algebra Final Exam Review – Graphs, Functions, and Applications
Guida di studio - Note intelligenti
 Appunti personalizzati basati sui tuoi materiali, ampliati con definizioni chiave, esempi e contesto.
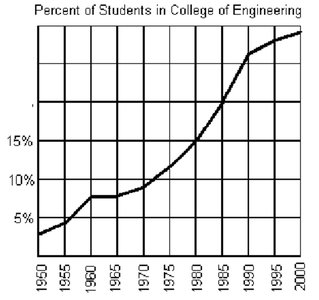
Q2. The graph below shows the percentage of students enrolled in the College of Engineering at Stale University. Use the graph to answer the following:
a. Does the graph represent a function?
b. If f represents the function, find f(1995).
c. If f(x) = 12%, what year is represented by x?
Background
Topic: Functions and Graph Interpretation
This question tests your understanding of how to interpret graphs, determine if a relation is a function, and extract information from a graph. You will also practice using function notation and solving for variables given a function value.
Key Terms and Concepts:
Function: A relation where each input (x-value) has exactly one output (y-value).
f(x): Function notation, representing the output value for a given input x.
Graph Interpretation: Reading values from a graph, such as finding the y-value for a given x, or vice versa.
Step-by-Step Guidance
For part (a), recall the definition of a function: for each x-value (year), there should be only one corresponding y-value (percentage). Check the graph to see if any vertical line would intersect the curve more than once.
For part (b), locate the year 1995 on the x-axis. Move vertically until you reach the curve, then read the corresponding y-value (percentage). This value is f(1995).
For part (c), find where the y-value (percentage) is 12% on the graph. Move horizontally from 12% until you intersect the curve, then drop down to the x-axis to find the corresponding year x.
Try solving on your own before revealing the answer!
Final Answers:
a. Yes, the graph represents a function because each year corresponds to only one percentage value.
b. f(1995) = 19% (read from the graph at x = 1995).
c. x = 1985 (when f(x) = 12%, the year is 1985).
Each answer is found by carefully reading the graph and applying the definition of a function.
