 Indietro
College Algebra: Functions – Relations, Graphs, and Transformations
Guida di studio - Note intelligenti
 Appunti personalizzati basati sui tuoi materiali, ampliati con definizioni chiave, esempi e contesto.
Section 1: Relations and Functions
Part 1: Relations
A relation is a correspondence between two variables, typically represented as a set X (the domain) and a set Y (the range). In a relation, each element from the domain is paired with at least one element from the range. The domain is often considered the set of possible inputs, while the range is the set of possible outputs.
Ways to Describe Relations: Relations can be described verbally, numerically (tables or ordered pairs), graphically (plots or mappings), or algebraically (equations).
Example: An astronaut measures the height of a rock at various times after throwing it upward. The relation between time and height can be represented as a table, a graph, or a mapping diagram.
Time (in seconds) | Height (in meters) |
|---|---|
0 | 20 |
1 | 19.2 |
2 | 16.8 |
2.5 | 15 |
3 | 12.8 |
4 | 7.2 |
5 | 0 |
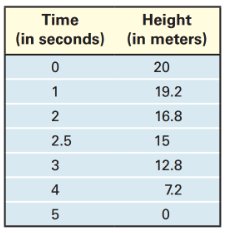
The same relation can be represented graphically as a scatter plot or as a mapping diagram, showing the correspondence between each time and its measured height.
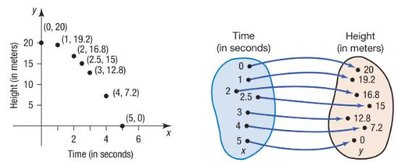
Algebraic Representation: The equation models the height y as a function of time x in this context.
Part 2: Functions
A function is a special type of relation in which each element of the domain corresponds to exactly one element of the range. All functions are relations, but not all relations are functions.
Vertical Line Test: A graph represents a function if and only if no vertical line intersects the graph at more than one point.
Determining Functions: For a set of ordered pairs, if any input (x-value) is paired with more than one output (y-value), the relation is not a function.
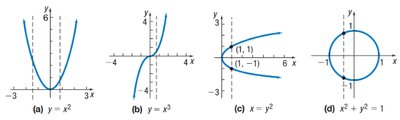
Examples:
y = x^2 and y = x^3 are functions (each x has one y).
x = y^2 and x^2 + y^2 = 1 are not functions (some x-values correspond to multiple y-values).
Part 3: Function Notation
Functions are commonly denoted by letters such as f or g. If f is a function, then for each x in the domain, the corresponding y in the range is written as , read as "f of x." This is called function notation. To evaluate a function at a specific value means to substitute that value for x and compute the result.
Example: If , then .
Part 4: Domain of Functions
The domain of a function is the set of all possible input values (x-values) for which the function is defined. The method for finding the domain depends on the type of function:
Polynomial Functions: Domain is all real numbers, .
Rational Functions: Domain excludes values that make the denominator zero.
Radical Functions: For even roots, the radicand must be non-negative.
Example: For , the domain is .
Part 5: Function Equations
From the equation of a function, you can determine:
Intercepts: Points where the graph crosses the axes.
x-intercept (zero): Value(s) of x where .
y-intercept: Value of .
Section 2: The Graph of a Function
Analyzing Graphs
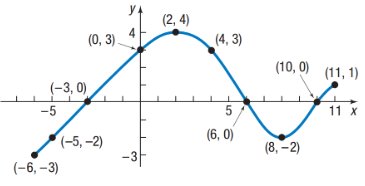
The graph of a function consists of all ordered pairs (x, y) plotted on a coordinate plane. From the graph, you can determine:
Domain and Range: The set of all x-values and y-values represented on the graph.
Intercepts: Where the graph crosses the axes.
Intervals of Positivity/Negativity: Where (above x-axis) or (below x-axis).
Increasing/Decreasing/Constant Intervals: Where the function rises, falls, or remains flat as x increases.
Local and Absolute Extrema: Local maxima/minima are the highest/lowest points in a neighborhood; absolute extrema are the highest/lowest points on the entire domain.
Section 3: Graphing Functions
Part 1: Library of Functions
A family of functions is a group of functions with similar shapes and properties. The parent function is the simplest form in each family. Common parent functions include:
Type | Parent Function | Domain | Range |
|---|---|---|---|
Linear | |||
Quadratic | |||
Cubic | |||
Square Root | |||
Cube Root | |||
Reciprocal | |||
Absolute Value |
Part 2: Graphing Functions Using Transformations
Functions can be graphed by applying transformations to their parent functions. Common transformations include:
Vertical Shifts: shifts the graph up by k units; shifts it down by k units.
Horizontal Shifts: shifts the graph right by h units; shifts it left by h units.
Vertical Stretch/Compression: stretches the graph vertically if and compresses it if .
Horizontal Stretch/Compression: compresses the graph horizontally if and stretches it if .
Reflections: reflects the graph over the x-axis; reflects it over the y-axis.
Summary Table of Transformations:
Transformation | Equation | Effect |
|---|---|---|
Vertical Shift Up | Up k units | |
Vertical Shift Down | Down k units | |
Horizontal Shift Right | Right h units | |
Horizontal Shift Left | Left h units | |
Vertical Stretch | , | Stretched vertically |
Vertical Compression | , | Compressed vertically |
Horizontal Compression | , | Compressed horizontally |
Horizontal Stretch | , | Stretched horizontally |
Reflection over x-axis | Reflected over x-axis | |
Reflection over y-axis | Reflected over y-axis |
