 Indietro
College Algebra: Linear Functions and Slope (Chapter 2 Study Notes)
Guida di studio - Note intelligenti
 Appunti personalizzati basati sui tuoi materiali, ampliati con definizioni chiave, esempi e contesto.
Functions and Graphs
Linear Functions and Slope
Linear functions are fundamental in algebra, representing relationships with constant rates of change. The slope of a line quantifies this rate, and several forms of linear equations allow for flexible modeling and graphing.
Definition of Slope
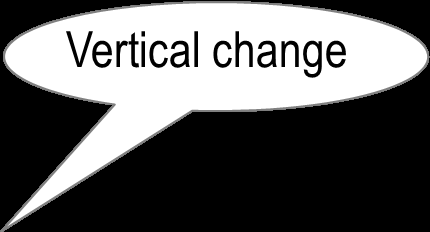
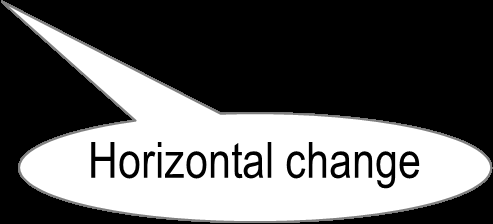
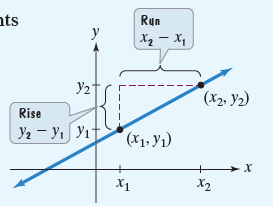
The slope of a line measures its steepness and direction. It is defined as the ratio of the vertical change (rise) to the horizontal change (run) between two distinct points on the line:
Formula:
Rise: (vertical change)
Run: (horizontal change)
Condition:
Example: Calculating Slope
Find the slope of the line passing through the points (4, -2) and (-1, 5):
The negative slope indicates the line decreases as x increases.
Point-Slope Form of a Line
The point-slope form is useful for writing the equation of a line when a point and the slope are known:
Formula:
Where is a point on the line and is the slope.
Example: Writing Point-Slope Form
Write the equation for a line with slope 6 passing through (2, -5):
Solve for y:
Slope-Intercept Form of a Line
The slope-intercept form is widely used for graphing and modeling:
Formula:
is the slope, is the y-intercept (where the line crosses the y-axis).
Graphing y = mx + b
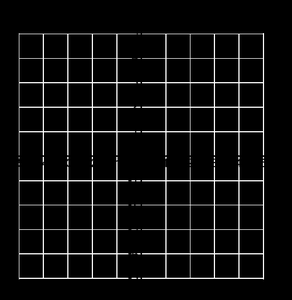
To graph a linear function:
Plot the y-intercept .
Use the slope (rise/run) to find a second point.
Draw a line through both points, extending in both directions.
Horizontal and Vertical Lines
Horizontal line: (slope = 0)
Vertical line: (slope is undefined)
General Form of a Line
Any line can be written in the general form:
A, B, and C are real numbers; A and B are not both zero.
Finding Slope and Intercepts from General Form
To find the slope and y-intercept:
Rewrite as
Slope:
Y-intercept:
Graphing Using Intercepts
To graph :
Find x-intercept: Set , solve for .
Find y-intercept: Set , solve for .
Plot both points and draw the line.
Modeling Data with Linear Functions
Linear functions can model real-world data, such as temperature versus carbon dioxide concentration. The slope represents the rate of change, and the y-intercept gives the starting value.
Given two data points, use the slope formula to find .
Write the equation in point-slope or slope-intercept form.
More on Slope
Parallel and Perpendicular Lines
Understanding relationships between lines is essential for geometry and algebra.
Parallel Lines
Nonvertical parallel lines have equal slopes.
Vertical lines (undefined slope) are parallel to each other.
Perpendicular Lines
Nonvertical perpendicular lines: Product of slopes is .
Horizontal lines (slope 0) are perpendicular to vertical lines (undefined slope).
Slope as Rate of Change
The slope of a linear function represents the rate of change of the dependent variable with respect to the independent variable. This concept is widely used in modeling and interpreting data.
For example, if the slope is 0.59, then the dependent variable increases by 0.59 units for each unit increase in the independent variable.
Average Rate of Change of a Function
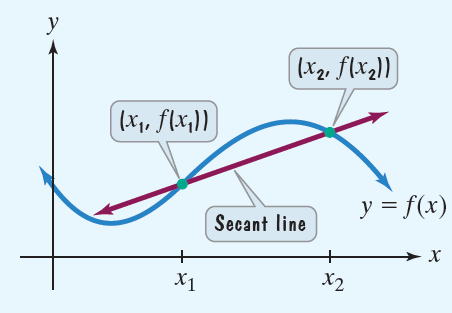
The average rate of change of a function between two points and is:
This is the slope of the secant line connecting the points and .
Example: Average Rate of Change
For from to :
Average rate of change:
