 Indietro
College Algebra Practice Problems – Step-by-Step Guidance
Guida di studio - Note intelligenti
 Appunti personalizzati basati sui tuoi materiali, ampliati con definizioni chiave, esempi e contesto.
Q7. Use the graph of the given quadratic function to determine the sign of the leading coefficient a, the vertex, the axis of symmetry, the x-intercepts, the y-intercept, the intervals of increasing/decreasing, and the domain and range.
Background
Topic: Quadratic Functions and Their Graphs
This question tests your ability to interpret the graph of a quadratic function (a parabola) and extract key features such as the vertex, axis of symmetry, intercepts, intervals of increase/decrease, and domain/range.
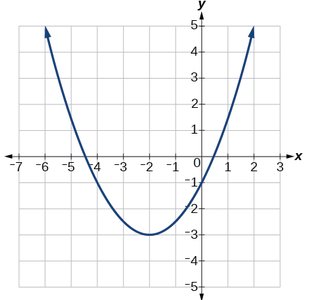
Key Terms and Concepts:
Vertex: The turning point of the parabola (either maximum or minimum).
Axis of Symmetry: The vertical line that passes through the vertex and divides the parabola into two symmetric parts.
x-intercepts: Points where the graph crosses the x-axis.
y-intercept: Point where the graph crosses the y-axis.
Intervals of Increasing/Decreasing: Where the function values are rising or falling as x increases.
Domain: All possible x-values for the function.
Range: All possible y-values for the function.
Leading Coefficient (a): The coefficient of in the quadratic equation .
Step-by-Step Guidance
Observe the direction the parabola opens. If it opens upwards, the leading coefficient is positive; if it opens downwards, is negative.
Identify the vertex by finding the lowest or highest point on the graph. The vertex has coordinates .
Determine the axis of symmetry. This is the vertical line , where is the x-coordinate of the vertex.
Find the x-intercepts (if any) by locating where the graph crosses the x-axis. These are points where .
Find the y-intercept by locating where the graph crosses the y-axis (where ).
Try solving on your own before revealing the answer!
Final Answer:
Leading coefficient : Positive (parabola opens upwards)
Vertex:
Axis of symmetry:
x-intercepts:
y-intercept:
Intervals of increasing:
Intervals of decreasing:
Domain:
Range:
All features are determined by analyzing the graph and using the definitions above.
