 Indietro
College Algebra Review: Functions, Graphs, Domain, and Range
Guida di studio - Note intelligenti
 Appunti personalizzati basati sui tuoi materiali, ampliati con definizioni chiave, esempi e contesto.
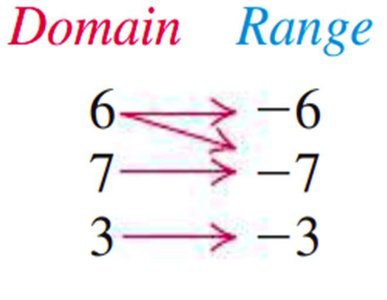
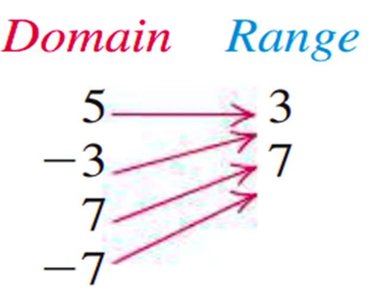
Q1. Determine whether each correspondence is a function. Justify your answer.
Background
Topic: Functions and Relations
This question tests your understanding of what makes a correspondence (mapping) a function. A function is a relation in which each element of the domain is paired with exactly one element of the range.
Key Terms:
Domain: The set of input values (usually x-values).
Range: The set of output values (usually y-values).
Function: A relation where each domain value maps to only one range value.
Step-by-Step Guidance
Examine each mapping diagram. For each domain value, check if it is paired with more than one range value.
If any domain value maps to more than one range value, the correspondence is not a function.
If every domain value maps to exactly one range value, the correspondence is a function.
Justify your answer by referencing the definition of a function.
Try solving on your own before revealing the answer!
Final Answer:
(a) Is a function because each domain value (6, 7, 3) maps to exactly one range value (-6, -7, -3).
(b) Is not a function because domain value 7 maps to both 3 and 7, violating the definition of a function.
Each domain value must map to only one range value for the correspondence to be a function.
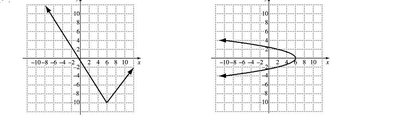
Q2. Determine whether each of the following is the graph of a function.
Background
Topic: Graphs of Functions
This question tests your ability to recognize whether a graph represents a function using the vertical line test.
Key Terms:
Vertical Line Test: If any vertical line crosses the graph more than once, the graph is not a function.
Function: Each input (x-value) has only one output (y-value).
Step-by-Step Guidance
Look at each graph and imagine drawing vertical lines at various x-values.
Check if any vertical line would intersect the graph at more than one point.
If so, the graph does not represent a function. If not, it does.
Use the definition of a function to justify your answer.
Try solving on your own before revealing the answer!
Final Answer:
(a) Is a function because every vertical line crosses the graph at most once.
(b) Is not a function because some vertical lines cross the graph more than once.
The vertical line test is a quick way to determine if a graph represents a function.
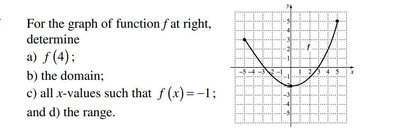
Q3. For the graph of function f at right, determine:
a)
b) The domain
c) All x-values such that
d) The range
Background
Topic: Reading Graphs of Functions
This question tests your ability to interpret a graph to find function values, domain, range, and specific x-values for a given output.
Key Terms:
Domain: All possible x-values for which the function is defined.
Range: All possible y-values (outputs) the function can take.
Function Value: is the y-value when x = a.
Step-by-Step Guidance
To find , locate x = 4 on the graph and read the corresponding y-value.
For the domain, identify the interval of x-values over which the graph exists.
To find all x-values such that , look for points on the graph where the y-value is -1 and note the corresponding x-values.
For the range, determine the lowest and highest y-values the graph attains.
Express domain and range in interval notation.
Try solving on your own before revealing the answer!
Final Answer:
a)
b) Domain:
c) at and
d) Range:
These answers are found by reading the graph carefully and using interval notation.
