 Indietro
College Algebra Study Notes: Equations, Graphs, and Functions
Guida di studio - Note intelligenti
 Appunti personalizzati basati sui tuoi materiali, ampliati con definizioni chiave, esempi e contesto.
Linear Equations
Definition and Properties
Linear equations are fundamental in algebra and represent equations of the first degree, meaning the highest power of the variable is one. - Definition: A linear equation in one variable is an equation that can be written in the form ax + b = 0, where a and b are constants and x is the variable. - Example: - Solving Linear Equations: Isolate the variable using inverse operations. 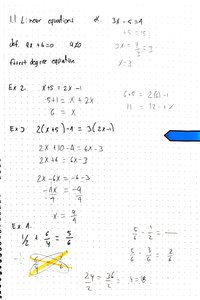
Solving Linear Equations: Examples
- Example 1: - Example 2:
Graphs
Distance and Midpoint Formulas
Graphs are visual representations of equations and relationships between variables. The distance and midpoint formulas are essential for analyzing points in the coordinate plane. - Distance Formula: Provides a method for computing the distance between two points and : - Example: Find the distance between and : - Midpoint Formula: The midpoint of the segment from to is: 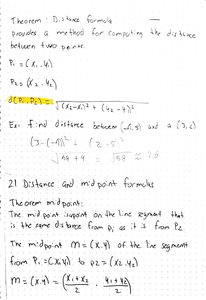
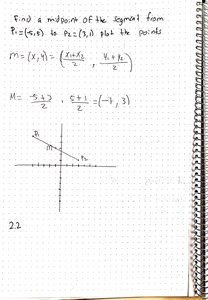
Intercepts of a Graph
Intercepts are points where a graph crosses the axes. - x-intercept: The x-coordinate where the graph crosses the x-axis. - y-intercept: The y-coordinate where the graph crosses the y-axis. - Example: For the graph shown, x-intercepts are and y-intercept is . 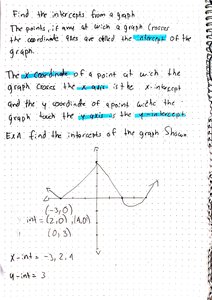
Finding Intercepts from Equations
- To find the x-intercept, set and solve for . - To find the y-intercept, set and solve for . - Example: x-intercepts: y-intercept: 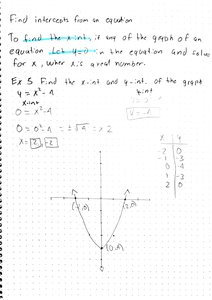
Symmetry in Graphs
Symmetry helps identify properties of graphs. - Symmetry with respect to x-axis: If for every , is also on the graph. - Symmetry with respect to y-axis: If for every , is also on the graph. - Symmetry with respect to origin: If for every , is also on the graph. 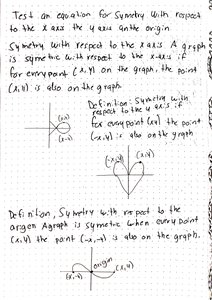
Testing for Symmetry
- Replace with for x-axis symmetry, with for y-axis symmetry, and both for origin symmetry. - Example: Test for symmetry. 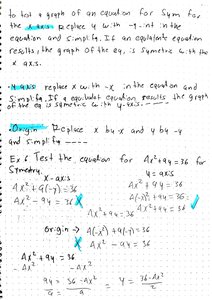
Slope of a Line
The slope measures the steepness of a line. - Positive slope: Line rises from left to right. - Negative slope: Line falls from left to right. - Zero slope: Line is horizontal. - Undefined slope: Line is vertical. - Formula: 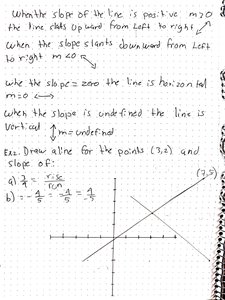
Equations of Lines
- Vertical line: - Horizontal line: - Point-slope form: 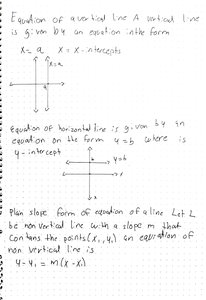
Slope-Intercept Form
- Equation: where is the slope and is the y-intercept. 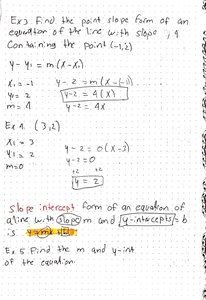
Functions and Their Graphs
Definition of Functions
Functions are a special type of relation where each input has exactly one output. - Domain: The set of all possible input values (x-values). - Range: The set of all possible output values (y-values). - Function: A relation from set X to set Y such that each element of X corresponds to exactly one element of Y. 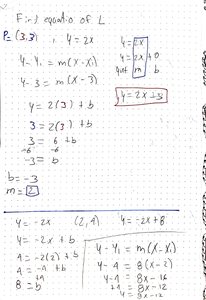
Identifying Functions
- If each input has only one output, the relation is a function. - Example: Menu items and prices: Each item has one price, so this is a function. 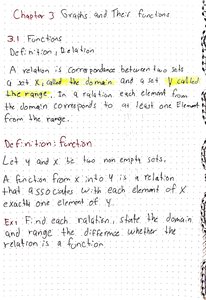
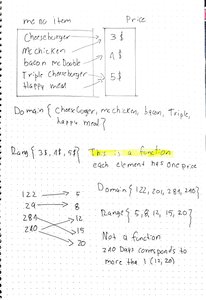
Domain and Range from Graphs
- Example: is a function. is not a function. 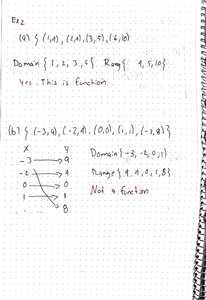
Function Notation
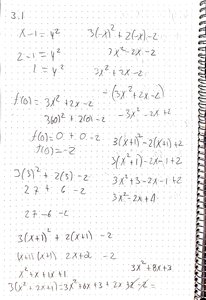
- Notation: represents the value of the function at . - Example: 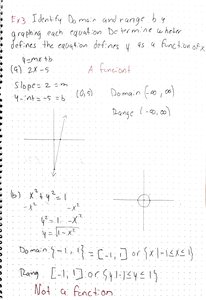
Difference Quotient
The difference quotient is used to measure the average rate of change of a function. - Definition: , - Example: For , 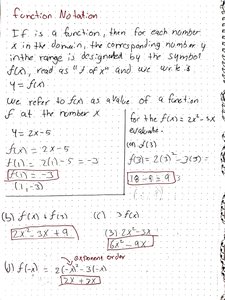
Finding Domain of Functions
- The domain is the set of real numbers for which the function is defined. - Exclude values that make denominators zero or radicands negative (for even roots). - Example: Domain: 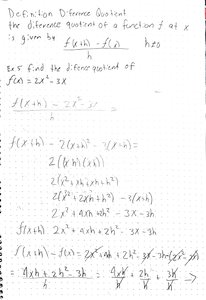
Operations on Functions
Functions can be added, subtracted, multiplied, or divided. - Example: , 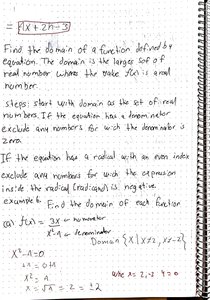
Graphs of Functions and Non-Functions
- Example: is a function; is not a function. 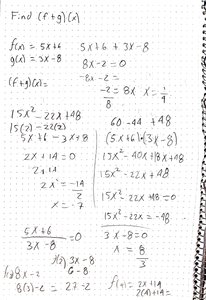
Properties of Functions: Even and Odd
- Even Function: for all in the domain. Graph is symmetric with respect to the y-axis. - Odd Function: for all in the domain. Graph is symmetric with respect to the origin. 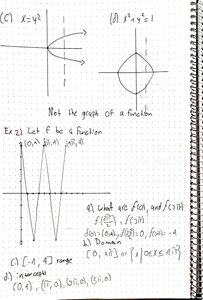
Increasing, Decreasing, and Constant Functions
- Increasing: Function rises as increases. - Decreasing: Function falls as increases. - Constant: Function remains unchanged as increases. 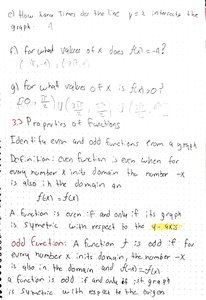
Local Maxima and Minima
- Local maximum: Occurs where the graph changes from increasing to decreasing. - Local minimum: Occurs where the graph changes from decreasing to increasing. 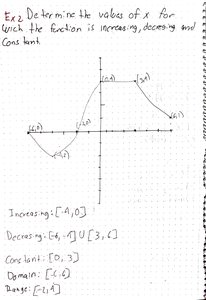
Evaluating Functions
- Substitute values into the function to find outputs. - Example: 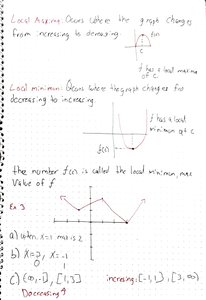
Summary Table: Types of Symmetry
Type of Symmetry | Test | Graph Property |
|---|---|---|
x-axis | Replace y with -y | Symmetric about x-axis |
y-axis | Replace x with -x | Symmetric about y-axis |
Origin | Replace x with -x and y with -y | Symmetric about origin |
Summary Table: Forms of Linear Equations
Form | Equation | Description |
|---|---|---|
Point-slope | Line with slope m through (x1, y1) | |
Slope-intercept | Line with slope m and y-intercept b | |
Vertical | Vertical line at x = a | |
Horizontal | Horizontal line at y = b |
